




我们的团队有超过700万的操盘手!
我们每天都在一起努力改善交易。我们得到了很高的成绩,并继续前进。
世界各地数以百万计的操盘手的认可是我们工作的最大赞赏! 您做出了您的选择,我们将尽一切努力来满足您的期望!
我们是一个共同的伟大团队!
InstaSpot. 自豪地为您工作!



The fa?ade of the US stock market looks flawless. The S&P 500 sits less than 2% from its record. Behind the fa?ade, the house is creaking. Small caps, banks, and utilities are suffering, and most market segments have slid at least 5% from their peaks — some by more than 15%.
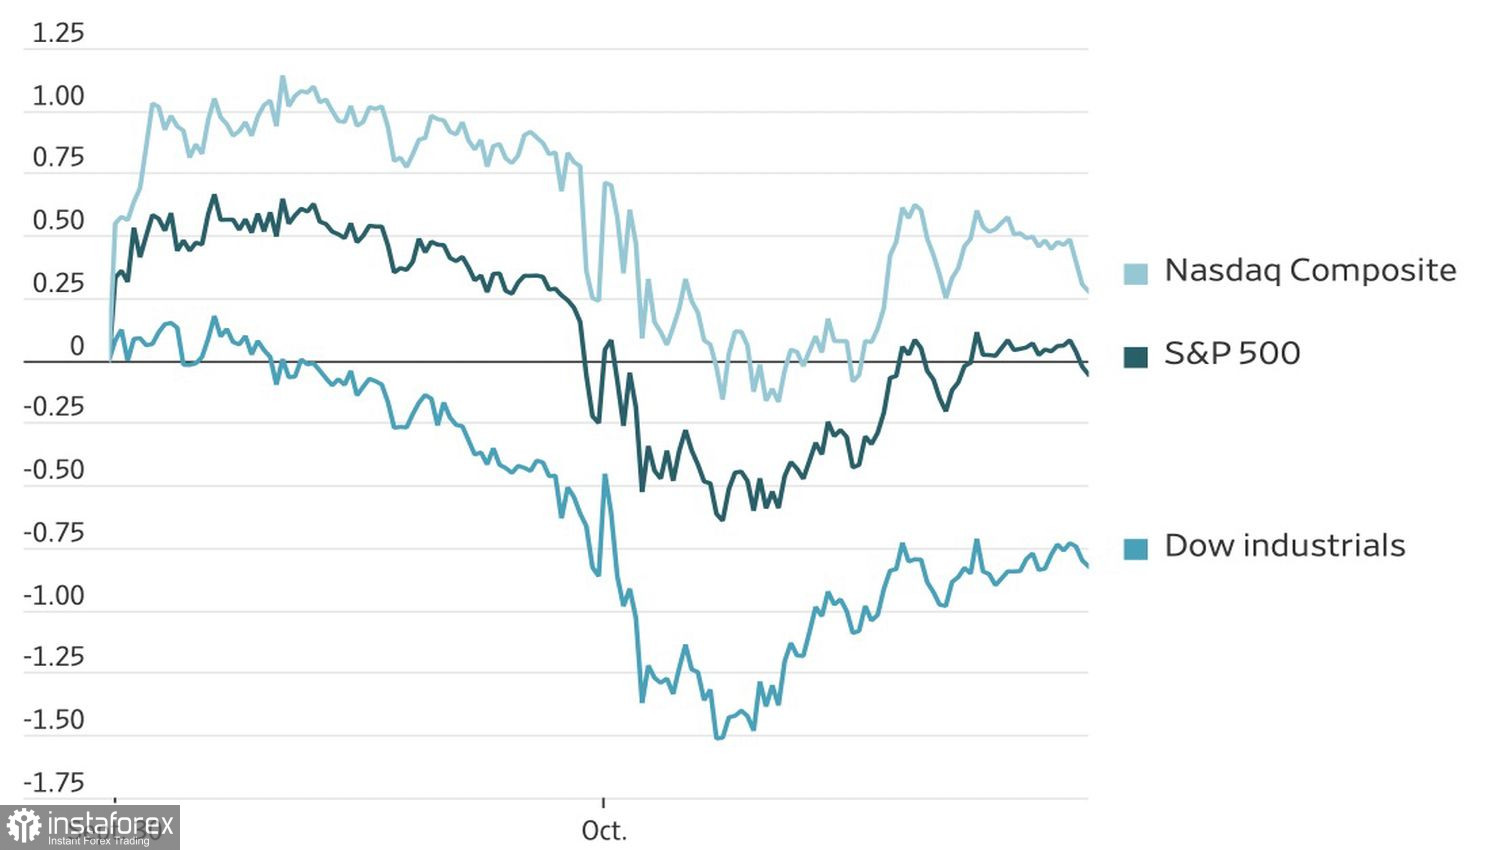
Dynamics of US benchmark stok indices
Selling in Treasuries is putting pressure on stocks. The 10-year yield has risen to 5.34% — the highest since 2002. Loss-making tech firms and issuers with weak balance sheets are taking the worst hits. They began lagging the broad index after the Fed's September move, the first rate hike in three years.
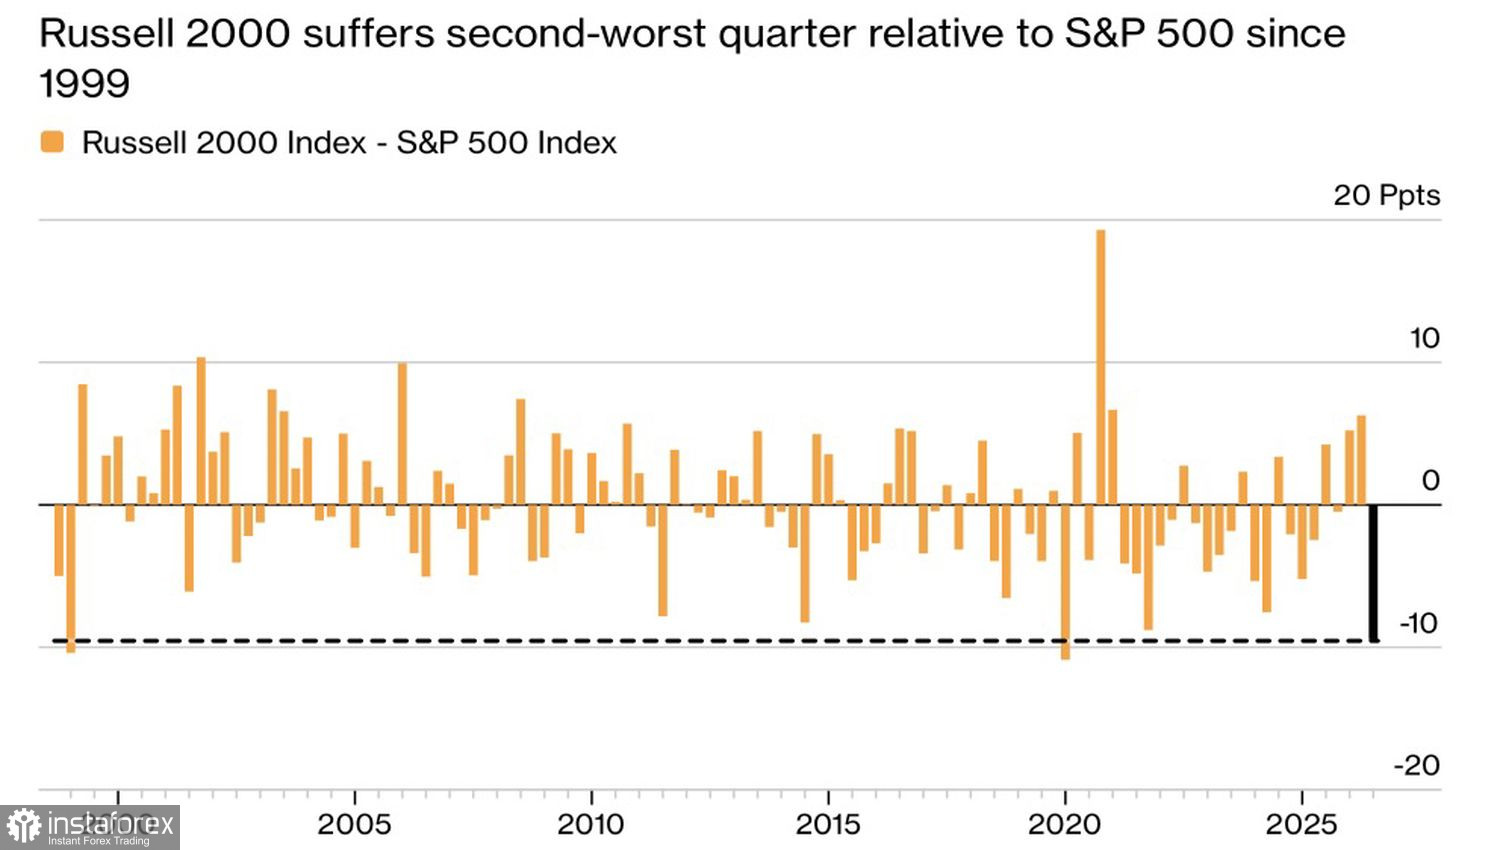
Small caps are exposed to the rate shock because of leverage. Bloomberg data show the Russell 2000 posted its second-worst quarter relative to the S&P 500 since 1999, underperforming by nearly 10 percentage points. The small-cap index is down 8.5% from its August 14 high and sits on the brink of a correction. The index contains a larger share of financials and industrials — sectors sensitive to the economic cycle — and more than a third of its components are "zombie" firms barely servicing their debt. Such stocks react to rate rises like dry grass to a spark.
Russell 2000 vs. S&P 500 divergence
Fed officials have lent a hand to the market. Vice Chair Philip Jefferson said the Fed may need more time to judge whether another policy move is necessary, echoing New York Fed President John Williams' view that there is no urgency to tighten further. Yields have pulled back from highs, and the S&P 500 recovered losses sparked by an industrial commodity price jump.
A supportive factor for the broad index is the still-resilient US labor market. Companies announced the fewest September layoffs since 2022, and initial jobless claims fell to their lowest since July. Economists expect nonfarm payrolls to rise by about 90,000 and the unemployment rate to hold near 4.1%.
AI boom underpins the S&P 500. Tallbacken Capital Advisors interprets the market's narrowness as a hallmark of a strong bull trend rather than a fatal flaw — they project the index at 8,500 by year-end, nearly 11% above current levels.
But AI is also the biggest risk. If tech earnings forecasts are cut, the pain will spread across the market like a crack in the ice. Geopolitics, expensive money and US midterms have historically rocked markets — how long can the S&P 500 keep smiling?
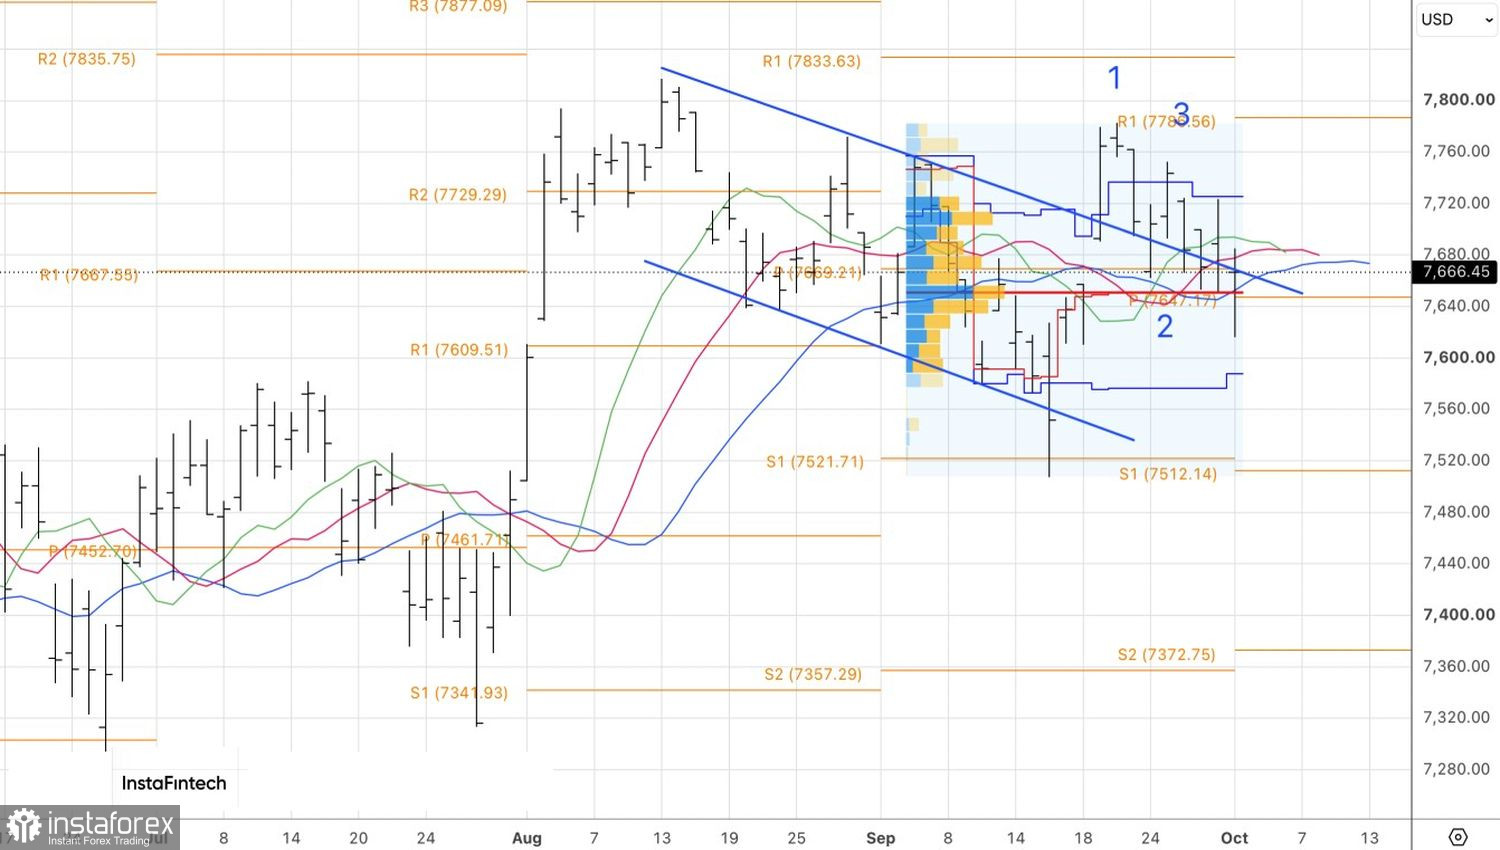
Technically, the daily S&P 500 chart formed a doji with a long lower shadow, signaling bear exhaustion. A breakout above its high near 7,685 would be a reason to build long positions in the broad index.
*这里的市场分析是为了增加您对市场的了解,而不是给出交易的指示。
InstaSpot分析评论将让您充分了解市场趋势! 作为InstaSpot的客户,您将获得大量的免费服务以实现有效的交易。





