


我们的团队有超过700万的操盘手!
我们每天都在一起努力改善交易。我们得到了很高的成绩,并继续前进。
世界各地数以百万计的操盘手的认可是我们工作的最大赞赏! 您做出了您的选择,我们将尽一切努力来满足您的期望!
我们是一个共同的伟大团队!
InstaSpot. 自豪地为您工作!


After a brief surge in buying, pressure on Bitcoin and Ethereum is returning. Bitcoin is currently trading at $65,500, while Ethereum has returned to around $1,780. Given that the Federal Reserve meeting is ahead, much could change.

According to the latest data from CryptoQuant, Bitcoin could retrace to $48,000. It is evident that the market has entered a state of deep stress after the drop from $80,000 to $60,000. The portion of Bitcoin supply that is at a loss has exceeded 50%, meaning most current holders purchased the asset above the current market price. Psychologically, this is a critical zone; many investors may feel prompted to realize their losses and exit, creating additional downward pressure on the price.
Two key indicators from CryptoQuant are sending simultaneous alarm signals. The Sell-side Risk Ratio, which measures the risk of large sell-offs relative to market liquidity, has issued a red signal for the first time since the last cycle. This indicates that the market is technically vulnerable to a wave of forced sales under any additional pressure—whether from new geopolitical shocks, hawkish rhetoric from the Fed at today's meeting, or further transfers from large holders to exchanges. Simultaneously, the CVDD (Coin Value Days Destroyed) model points to $48,000 as a likely lower level for the current cycle.
It is worth noting that the historical bearish cycle, which began in October 2025, is expected to last approximately 18 months—potentially until early 2027. The average purchase price for investors is around $53,000, and true market capitulation has not yet occurred. The levels of $48,000 and $43,000 appear quite realistic in the mid-term.
Regarding short-term trading strategies, the conditions are outlined below.
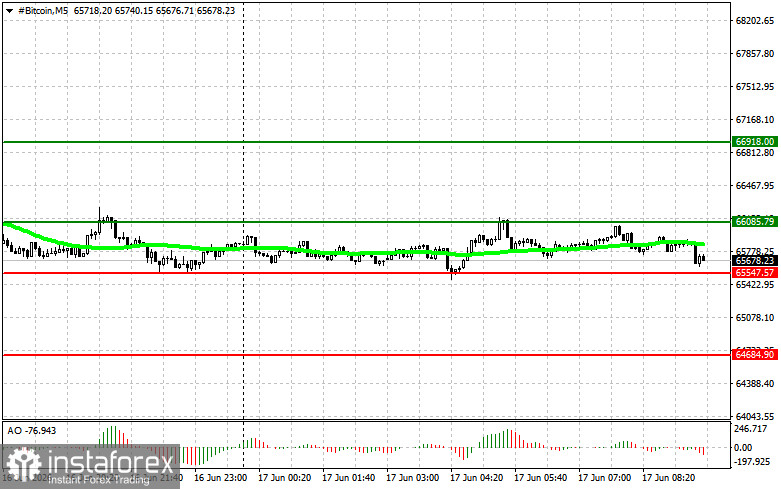
Scenario #1: I plan to buy Bitcoin today at an entry point around $66,000, with a growth target of $66,900. At around $66,900, I will exit the buy positions and sell immediately on a rebound. Before buying on the breakout, ensure that the 50-day moving average is below the current price and that the Awesome indicator is above zero.
Scenario #2: I can buy Bitcoin from the lower boundary of $65,500 if there is no market reaction to its breakout back to the levels of $66,000 and $66,900.
Scenario #1: I plan to sell Bitcoin today at an entry point around $65,500, with a target of a decline to $64,800. At around $64,800, I will exit the sell positions and buy immediately on the rebound. Before selling on the breakout, ensure that the 50-day moving average is above the current price and that the Awesome indicator is below zero.
Scenario #2: I can sell Bitcoin from the upper boundary of $66,000 if there is no market reaction to its breakout back to the levels of $65,500 and $64,800.
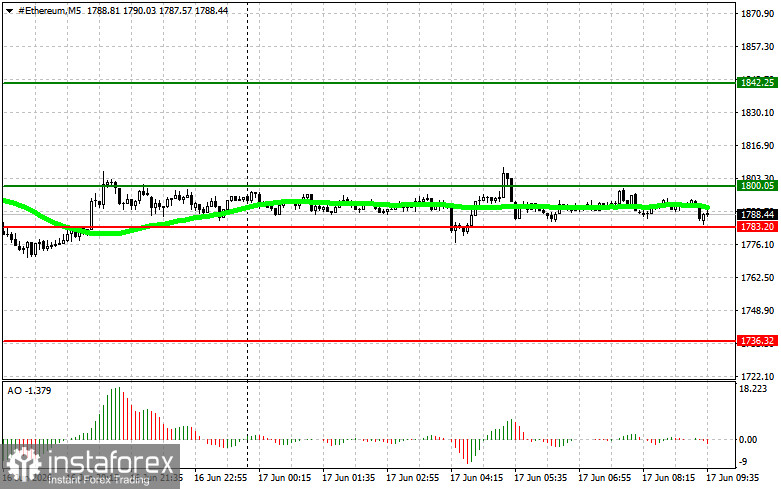
Scenario #1: I plan to buy Ethereum today at an entry point around $1,800, with a growth target of $1,842. At around $1,842, I will exit the buy positions and sell immediately on a rebound. Before buying on the breakout, ensure that the 50-day moving average is below the current price and that the Awesome indicator is above zero.
Scenario #2: I can buy Ethereum from the lower boundary of $1,783 if there is no market reaction to its breakout back to the levels of $1,800 and $1,842.
Scenario #1: I plan to sell Ethereum today at an entry point around $1,783, with a target of $1,736. Around $1,736, I will exit the sell positions and buy immediately on the rebound. Before selling on the breakout, ensure that the 50-day moving average is above the current price and that the Awesome indicator is below zero.
Scenario #2: I can sell Ethereum from the upper boundary of $1,800 if there is no market reaction to its breakout back to the levels of $1,783 and $1,736.
*这里的市场分析是为了增加您对市场的了解,而不是给出交易的指示。
InstaSpot分析评论将让您充分了解市场趋势! 作为InstaSpot的客户,您将获得大量的免费服务以实现有效的交易。


