


The legend in the InstaSpot team!
Legend! You think that's bombastic rhetoric? But how should we call a man, who became the first Asian to win the junior world chess championship at 18 and who became the first Indian Grandmaster at 19? That was the start of a hard path to the World Champion title for Viswanathan Anand, the man who became a part of history of chess forever. Now one more legend in the InstaSpot team!


Borussia is one of the most titled football clubs in Germany, which has repeatedly proved to fans: the spirit of competition and leadership will certainly lead to success. Trade in the same way that sports professionals play the game: confidently and actively. Keep a "pass" from Borussia FC and be in the lead with InstaSpot!
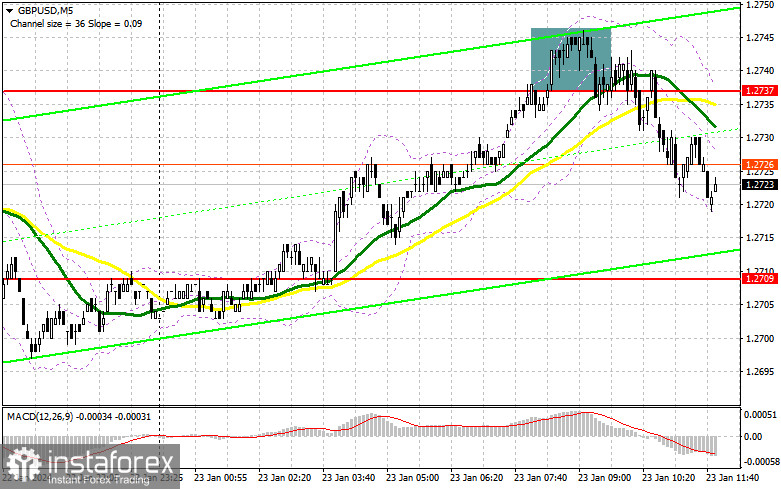
In my morning forecast, I drew attention to the level of 1.2737 and planned to make trading decisions based on it. Let's look at the 5-minute chart and analyze what happened there. After updating another daily high, the rise and the formation of a false breakout at this level provided a selling entry point, resulting in a drop in the pair by only 20 points. The technical picture was slightly revised for the second half of the day.
To open long positions on GBP/USD, the following conditions are required:
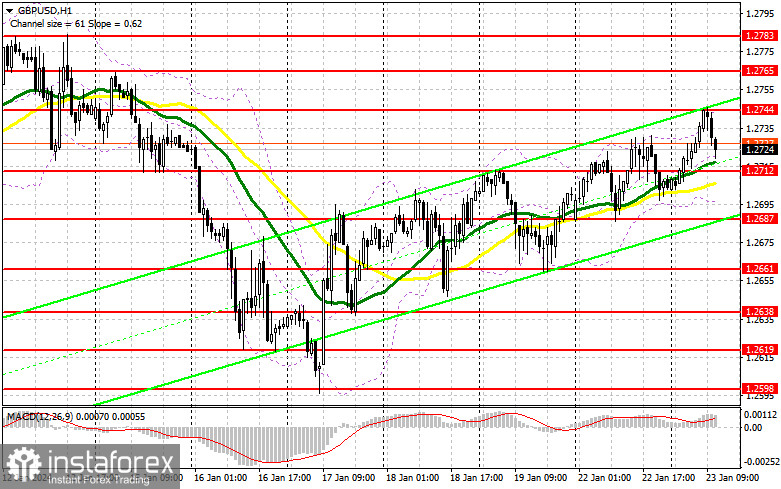
The absence of significant UK statistics has influenced the pound's direction. Still, buyers continue to control the market, pushing for the daily high to be updated each time, indicating an upward trend. Considering that there is no important US data today, bulls will likely attempt to push the pound even higher. If pressure on GBP/USD increases, buyers must prove their presence near the new support at 1.2712, where moving averages are located, playing in their favor. I will act on a false breakout, providing an excellent entry point for long positions to continue the bullish trend with the target of updating 1.2744. Breaking and consolidating above this range will strengthen demand for the pound and open the path to 1.2765. The ultimate target will be the maximum at 1.2783, where I intend to make a profit. With the pair's decline and a lack of bullish activity at 1.2712, trading will move into a sideways channel, and pressure on the pound will increase. In such a case, I will postpone purchases until a test of 1.2687. Only a false breakout will confirm the correct entry point into the market. I plan to buy GBP/USD immediately on a bounce from the minimum of 1.2661 with the goal of a 30-35 point intraday correction.
To open short positions on GBP/USD, the following conditions are required:
Sellers are acting reluctantly as the bull market updates daily highs. Since sellers have again failed to defend the maximum, there is no significant reason to expect a sharp decline in the pair. I will act on the rise following the formation of a false breakout around the new resistance at 1.2744, the daily high. This will confirm the entry point for selling to return to the support at 1.2712, formed during the first half of the day. Breaking and retesting this range from bottom to top will strike a more serious blow to bullish positions, restoring market balance and opening the path to 1.2687. The ultimate target will be the area around 1.2661, where I intend to make a profit. In the event of further growth in GBP/USD and a lack of activity at 1.2744 in the second half of the day, buyers will continue to hold the initiative in anticipation of a move to the annual maximum. In such a case, I will postpone selling until a false breakout at 1.2765. Without a downward movement there, I will sell GBP/USD immediately on a bounce from 1.2783, but only with the expectation of a pair correction down by 30-35 points.
Indicator Signals:
Moving Averages:
Trading is conducted above the 30 and 50-day moving averages, indicating further pound growth.
Note: The author analyzes the moving averages' period and prices on the hourly chart (H1) and differs from the general definition of classic daily moving averages on the daily chart (D1).
Bollinger Bands:
In the event of a decline, the lower boundary of the indicator at around 1.2700 will act as support.
Indicator Descriptions:
*这里的市场分析是为了增加您对市场的了解,而不是给出交易的指示。
InstaSpot分析评论将让您充分了解市场趋势! 作为InstaSpot的客户,您将获得大量的免费服务以实现有效的交易。


