


我们的团队有超过700万的操盘手!
我们每天都在一起努力改善交易。我们得到了很高的成绩,并继续前进。
世界各地数以百万计的操盘手的认可是我们工作的最大赞赏! 您做出了您的选择,我们将尽一切努力来满足您的期望!
我们是一个共同的伟大团队!
InstaSpot. 自豪地为您工作!


The economic calendar commonly lacks high-impact economic data on Monday. Yesterday was no exception. The US, the UK, and the EU did not release any economic reports.
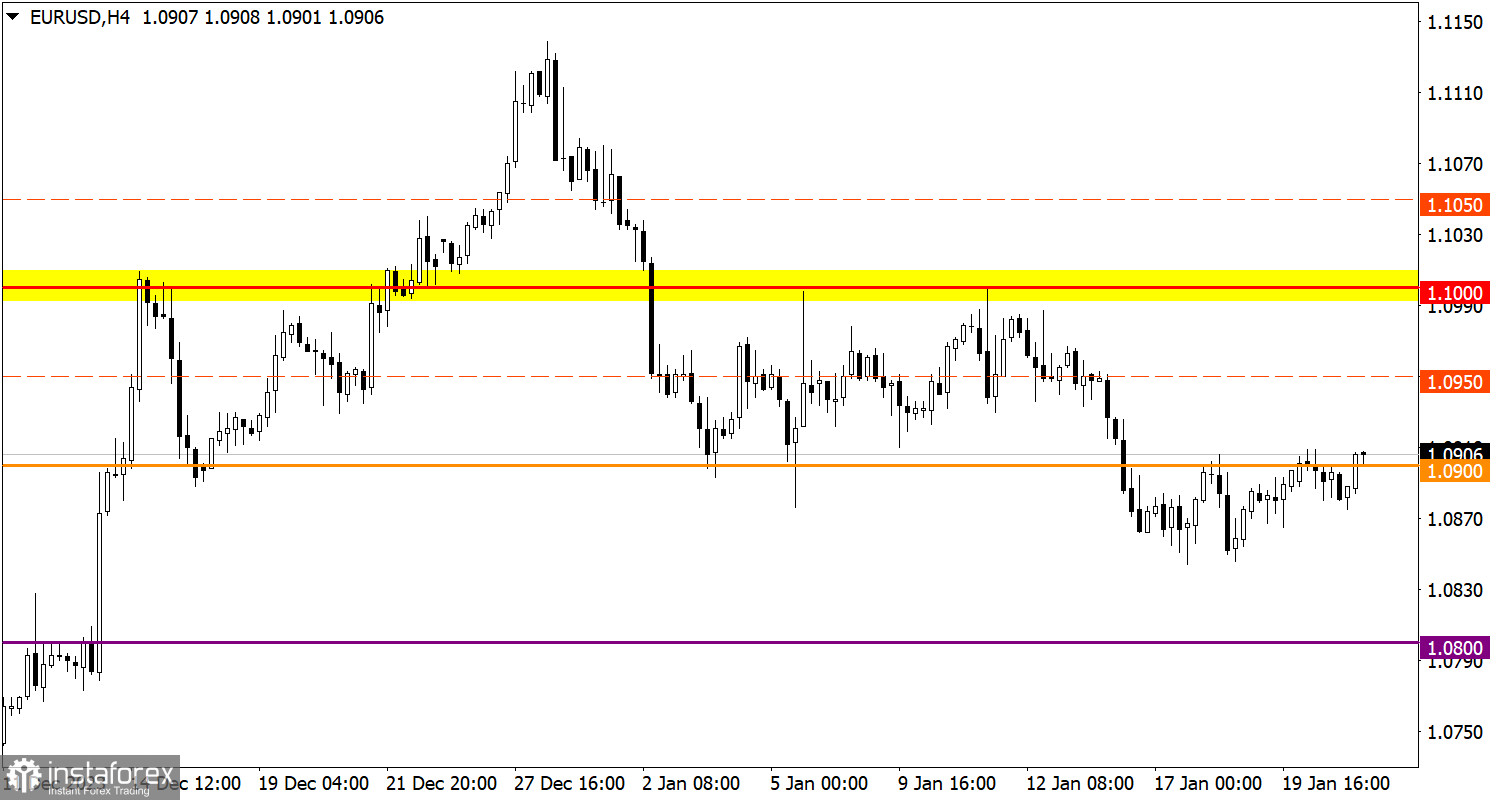
The EUR/USD pair has been moving around the 1.0900 level for the third day in a row with low trading activity. The level of 1.0850 serves as a variable support on the path of sellers. At this level, there was a reduction in short positions on EUR/USD.
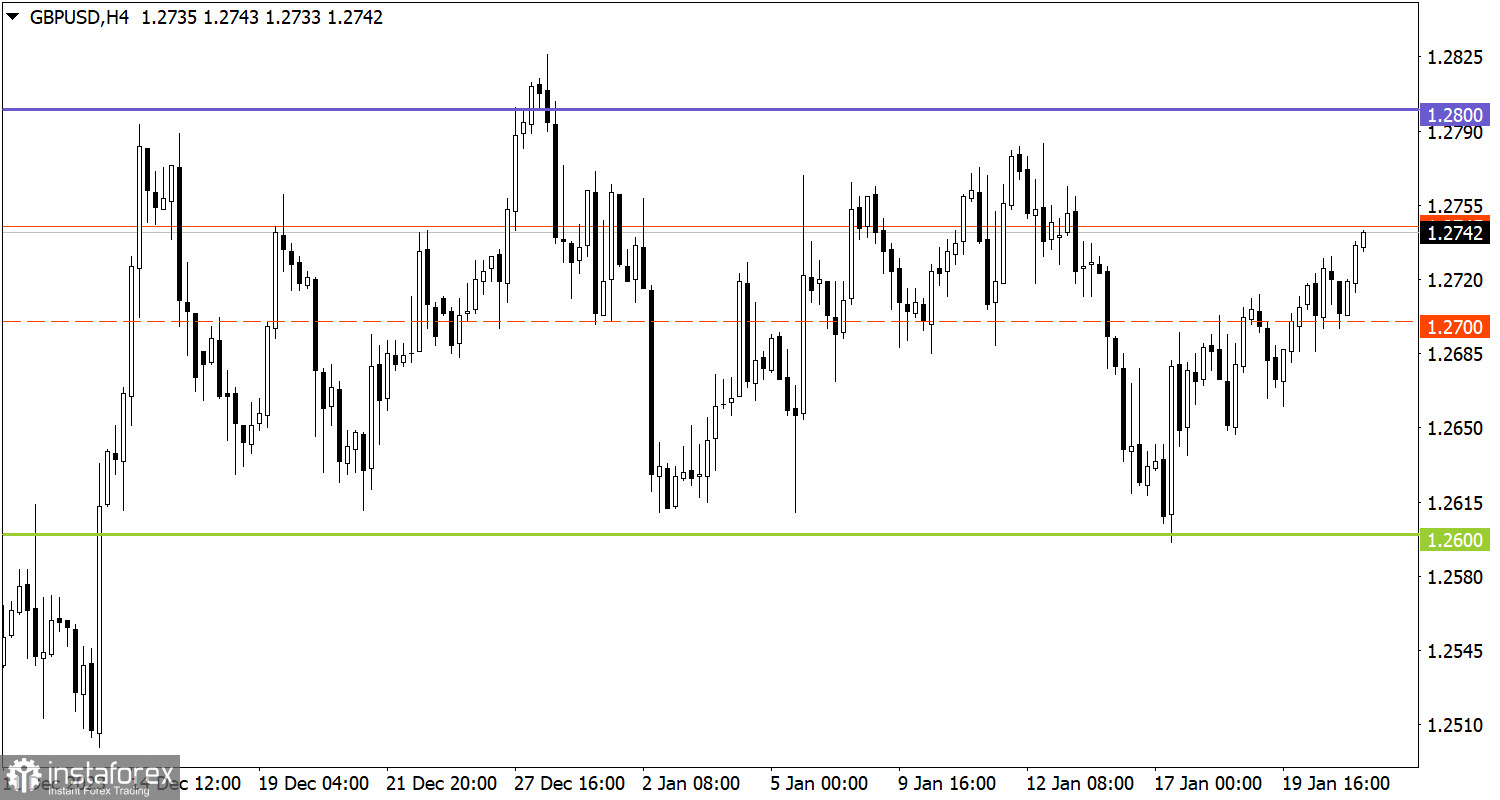
The GBP/USD currency pair is trading within the sideways channel of 1.2600/1.2800, consistently approaching the defined borders. At the moment, we see the consolidation above the average level of 1.2700, which indicates an increase in long positions on the range-bound market.

Today the economic calendar is equally empty as on Monday. No macroeconomic data will be released in the US, the UK, and the EU.
Consolidation of the price above 1.0900 during the day may lead to an increase in the volume of long positions in the direction towards 1.1000. As for the bearish scenario, it will come into play if the price drops below 1.0850.
In this situation, we may go ahead trading within the borders of the sideways channel. We reckon the instrument could approach the upper border at 1.2800.
However, we should not forget that the range-bound market is a temporary pattern, which leads to the accumulation of trading forces and abundant attention from speculators. As a result, the instrument will gain a certain momentum and break any of the borders. When the flat market is over, the price will indicate a further direction in the market. For this reason, you should always consider the breakout strategy.
The candlestick chart type consists of graphic rectangles in white and black with lines at the top and bottom. With a detailed analysis of each individual candle, you can see its characteristics relative to a particular time frame: opening price, closing price, maximum and minimum price.
Horizontal levels are price coordinates relative to which a price may stop or revered its trajectory. In the market, these levels are called support and resistance.
Circles and rectangles are highlighted examples where the price developed. This color highlighting indicates horizontal lines that may put pressure on the price in the future.
Up/down arrows are guidelines for possible price direction in the future.
*这里的市场分析是为了增加您对市场的了解,而不是给出交易的指示。
InstaSpot分析评论将让您充分了解市场趋势! 作为InstaSpot的客户,您将获得大量的免费服务以实现有效的交易。


