


EUR/USD
Analysis:
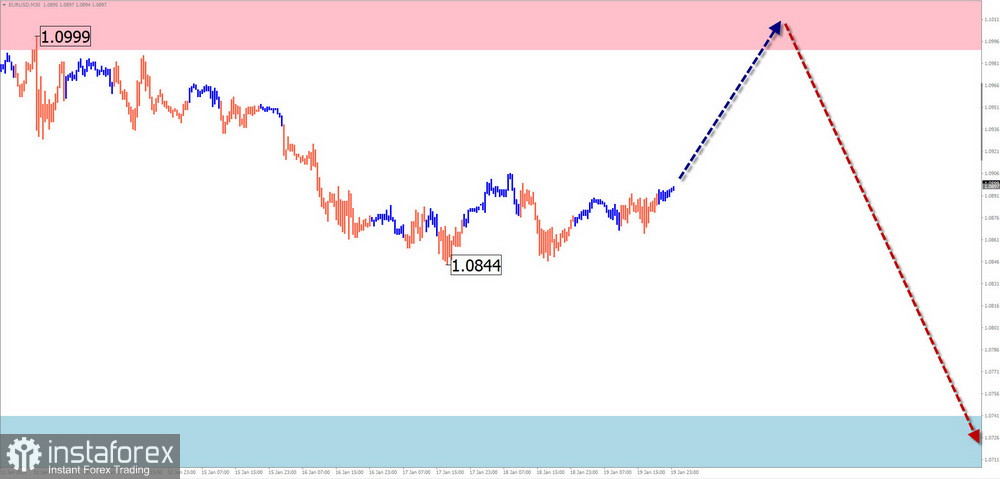
Since October last year, the euro currency pair has developed an ascending, shifting flat pattern on the chart. Price growth has brought quotes to the area of a powerful potential reversal zone on the weekly scale chart. Over the past three weeks, the price has been moving in a sideways channel between opposing zones.
Forecast:
Throughout the upcoming week, the euro's overall sideways price movement is highly likely to continue. Pressure on the resistance zone can be expected in the next couple of days. A brief breakthrough of its upper boundary is not excluded. Subsequently, a return to the price range between the nearest zones is expected, with a gradual decline towards the support level.
Potential Reversal Zones
Resistance:
Support:
Recommendations:
Purchases: Small volumes may be possible during individual trading sessions.
Sales: Sales with reduced volume may become possible after confirming reversal signals on the trading systems that are being used.
USD/JPY
Analysis:
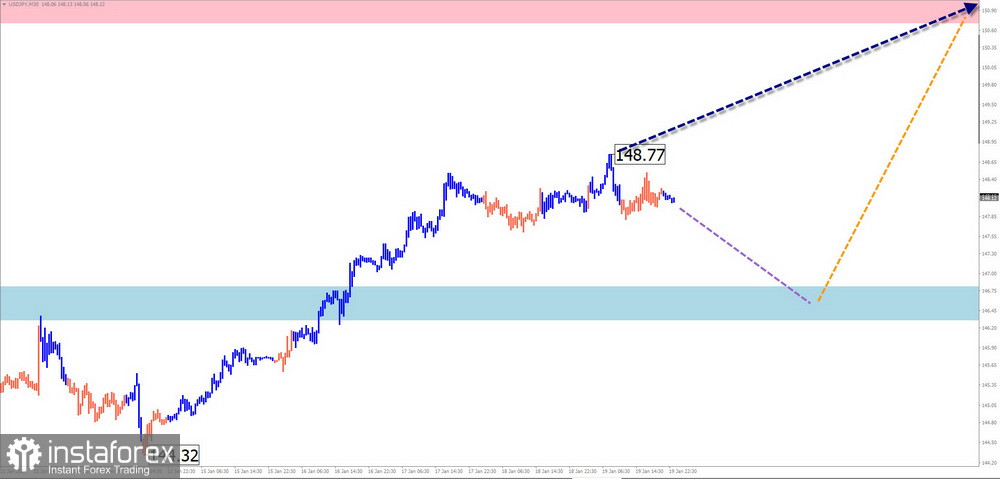
An ascending wave zigzag pattern has been developing on the chart of the Japanese yen against the US dollar since July of last year. After a corrective phase, quotes changed direction at the end of December. Currently, the price has broken through the potential reversal zone. Before continuing the upward movement, it is necessary to consolidate above the breached level.
Forecast:
In the coming days, a flat price movement towards the calculated support levels is expected, with a reversal and a resumption of growth by the end of the week, leading to a rise in prices up to the resistance zone. When changing direction, a brief breakthrough of the upper boundary of the zone cannot be ruled out.
Potential Reversal Zones
Resistance:
Support:
Recommendations:
Purchases: There are no conditions for such transactions for this pair.
Sales: Sales will be possible after confirmed reversal signals within the resistance zone.
GBP/JPY
Analysis:
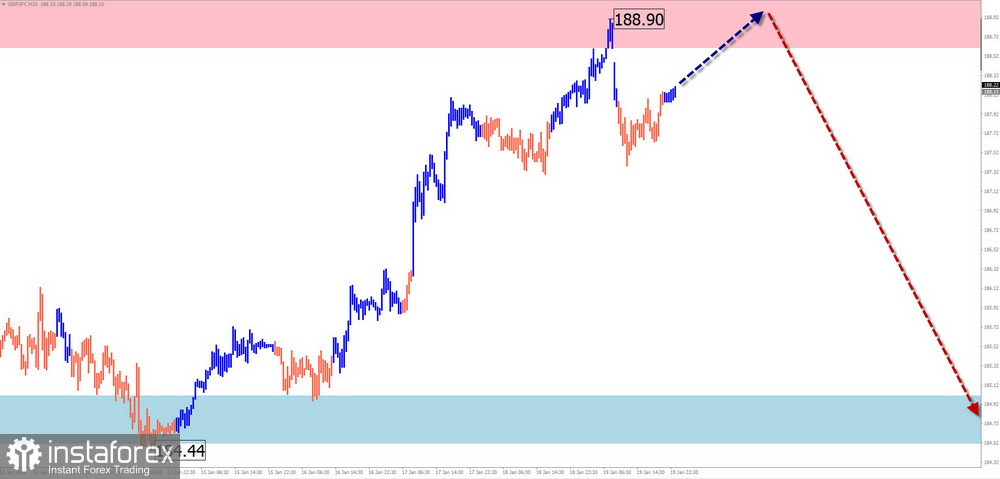
Since early December of last year, an ascending wave zigzag pattern has been forming on the chart of the pound/yen pair. Its scale has closely approached the level of the D1 timeframe. At the time of analysis, the price has reached the lower boundary of a strong resistance zone. Within the wave structure, a correction is needed.
Forecast:
The complete completion of the upward movement is expected throughout the upcoming week. A reversal and the beginning of a decline can be anticipated in the area of the calculated resistance. The highest activity can be expected by the end of the week.
Potential Reversal Zones
Resistance:
Support:
Recommendations:
Purchases: There is no potential for buying.
Sales: Sales may become possible after confirming reversal signals within the resistance zone appear.
USD/CAD
Analysis:
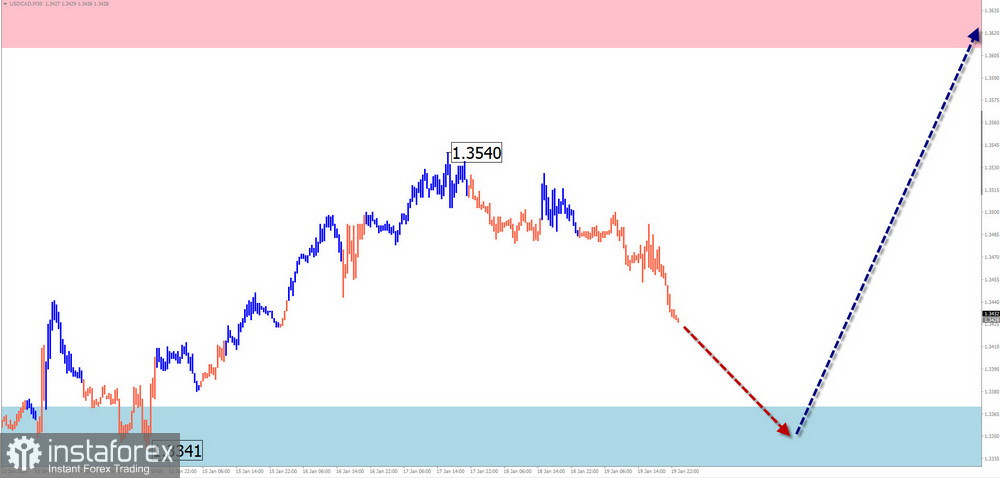
An ascending wave with reversal potential has been forming on the chart of the major Canadian dollar pair since late December of last year. A week ago, a corrective phase in the wave structure began as a shifting descending flat. Its structure appears incomplete at the time of analysis.
Forecast:
A price decrease towards the calculated support zone can be expected throughout the upcoming week. Subsequently, a course change can be anticipated. Upon reversal, pressure on the lower boundary of the price corridor cannot be ruled out. The highest volatility is likely by the end of the week.
Potential Reversal Zones
Resistance:
Support:
Recommendations:
Sales: Sales have limited potential and may result in losses.
Purchases: Buying with fractional lots may become possible after corresponding signals around the calculated support zone appear.
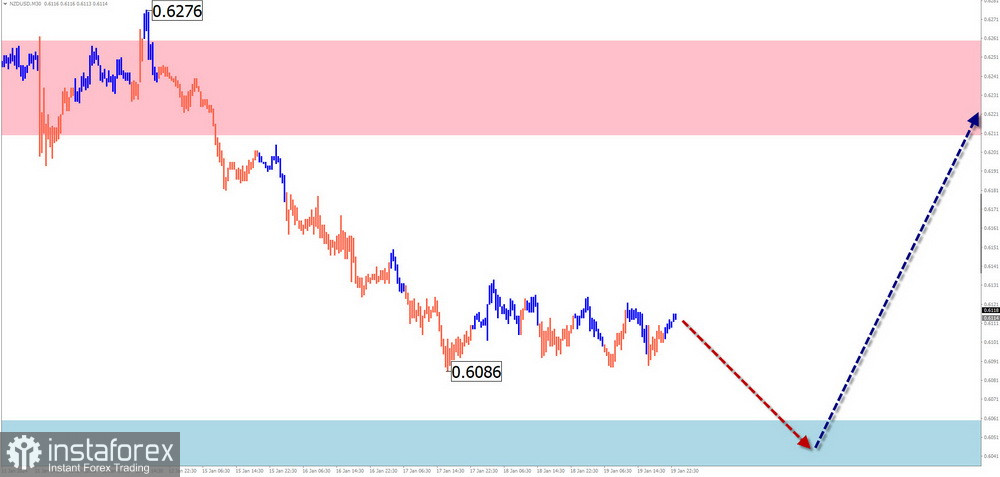
NZD/USD
Brief Analysis:
On the New Zealand dollar chart since late October, there has been a steady rise in its rate against the North American currency. Since mid-December, quotes have formed a corrective phase as an extended flat. The price has reached the upper limit of the preliminary target zone. The correction structure appears complete, but there are no signs of an imminent reversal on the chart.
Weekly Forecast:
With high probability, one can assume stable price growth from the support boundaries to the calculated resistance zone in the upcoming weekly period. At the beginning of the week, a brief downward pressure and a breakthrough of the lower boundary of the support zone cannot be ruled out.
Potential Reversal Zones
Resistance:
Support:
Recommendations:
Sales: There are no prospects for selling, and it may result in losses.
Purchases: Buying may become the main direction of trading after confirmation signals appear on your used trading systems.
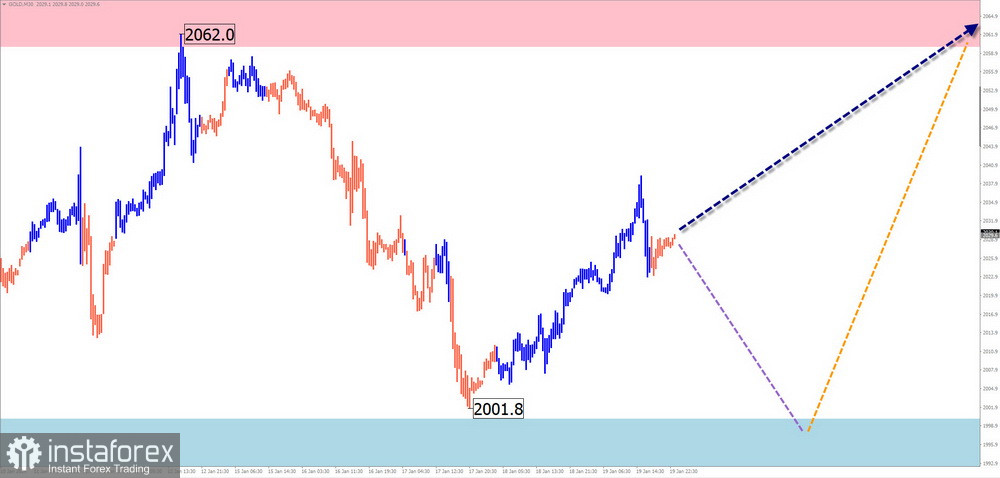
Gold
Analysis:
Since early December last year, gold prices have formed a flat wave. This section represents a correction in the structure of a larger upward trend. The price moves within a flat corridor along the potential reversal zone on the weekly scale chart.
Forecast:
Throughout the upcoming week, a continuation of the overall sideways movement in gold prices is expected. After a likely decrease in the support zone, a gradual rise can be expected toward the support zone.
Potential Reversal Zones
Resistance:
Support:
Recommendations:
Purchases: Buying with fractional lots within intraday trading may be considered.
Sales: Conditions for such transactions are not present.
Explanation: In simplified wave analysis (SWA), all waves consist of three parts (A-B-C). Only the last unfinished wave is analyzed in each timeframe. Dashed lines indicate expected movements.
Note: Wave analysis does not consider the duration of instrument movements in time!
*这里的市场分析是为了增加您对市场的了解,而不是给出交易的指示。
InstaSpot分析评论将让您充分了解市场趋势! 作为InstaSpot的客户,您将获得大量的免费服务以实现有效的交易。


