




The legend in the InstaSpot team!
Legend! You think that's bombastic rhetoric? But how should we call a man, who became the first Asian to win the junior world chess championship at 18 and who became the first Indian Grandmaster at 19? That was the start of a hard path to the World Champion title for Viswanathan Anand, the man who became a part of history of chess forever. Now one more legend in the InstaSpot team!




Borussia is one of the most titled football clubs in Germany, which has repeatedly proved to fans: the spirit of competition and leadership will certainly lead to success. Trade in the same way that sports professionals play the game: confidently and actively. Keep a "pass" from Borussia FC and be in the lead with InstaSpot!
The US labor market showed resilience in November beyond expectations. The unemployment rate unexpectedly fell to 3.7%, while the forecast had projected it to remain at around 3.9%. The number of jobs, excluding farm employment, increased by 199K in November, which exceeded analysts' forecasts of 180K new jobs. The market response to these statistics was manifested in high volatility.
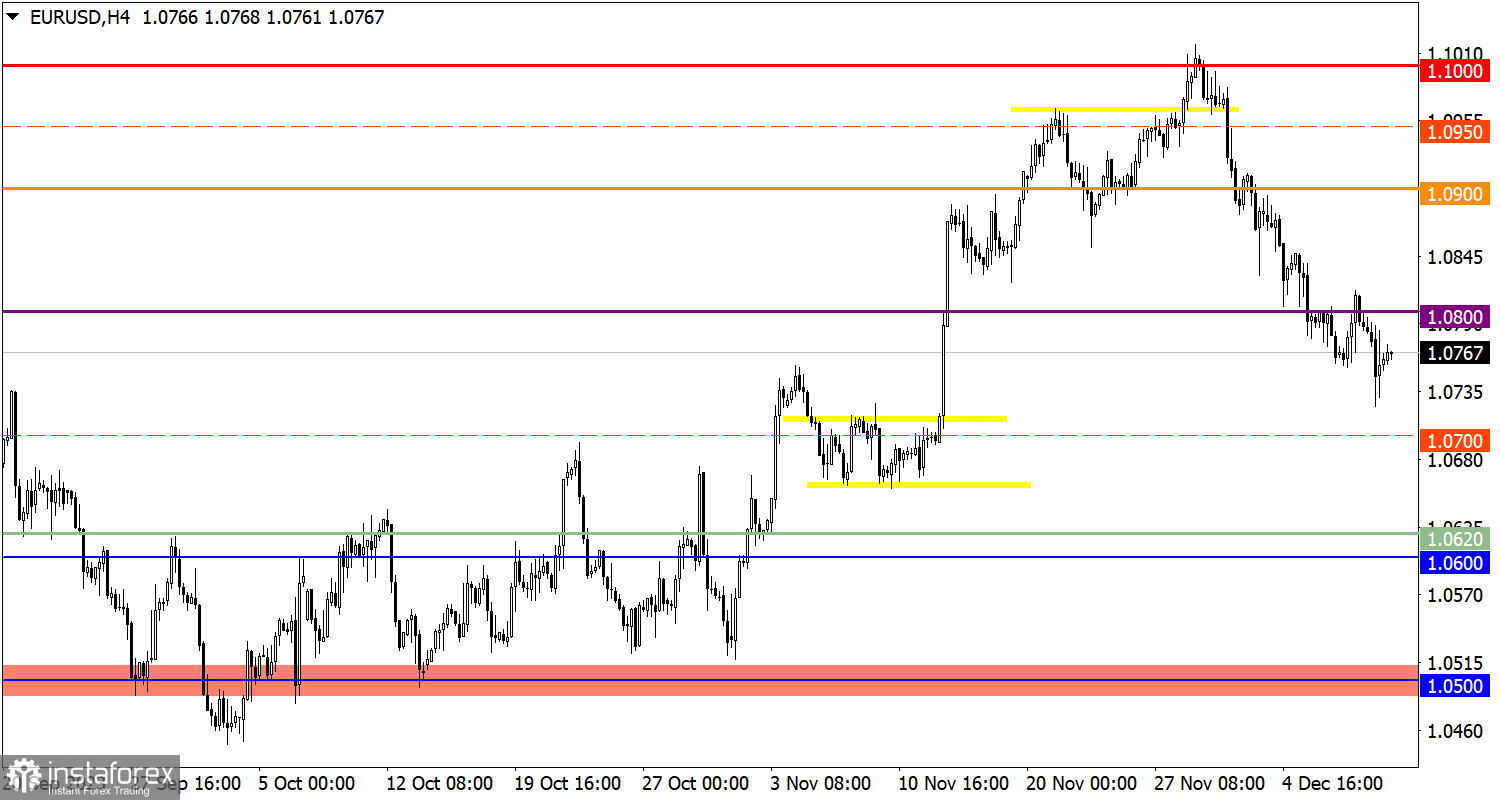
During the North American on Friday, the EUR/USD pair traded robustly. As a result, the instrument extended the current correction cycle. Importantly, traders rushed to open short positions. However, the trading day ended with an increase in long positions. Thus, EUR/USD closed the trading day slightly lower with a dip of 30 pips.
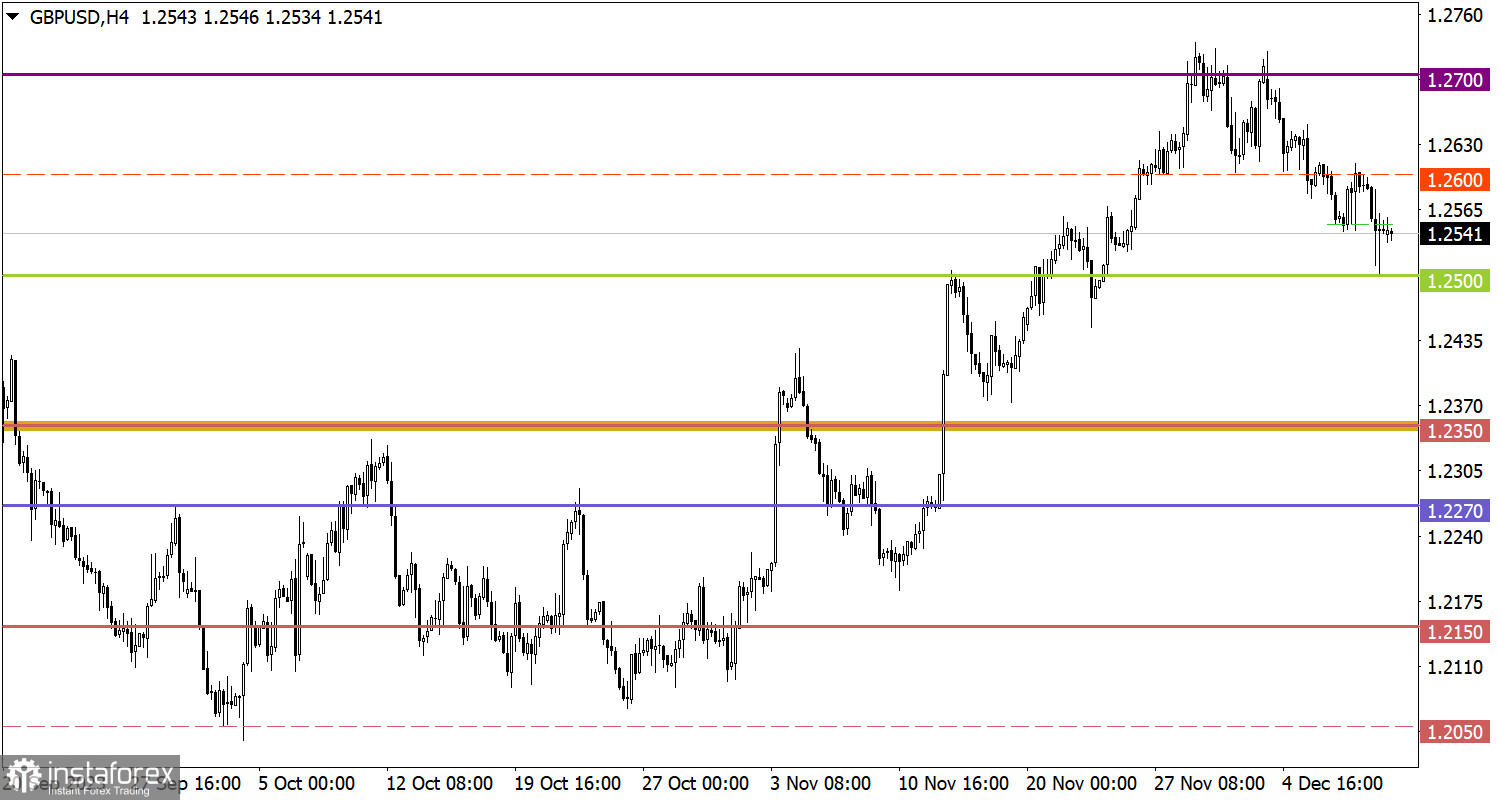
Speaking about the GBP/USD pair, the support level of 1.2500 was reached during speculative activity, while the volume of short positions quickly went down. This led to a technical pullback, even though the instrument remained under bearish pressure.
As usual, the economic calendar is empty on Monday. So, no important statistical data in the EU, UK, and the US will be released.
However, many important events are expected throughout the trading week, including US inflation data and policy meetings of the Federal Reserve, the European Central Bank, and the Bank of England. Therefore, financial markets will trade with higher volatility.
Despite the technical signal that the euro is oversold in the short term, the currency pair is still trading under bearish pressure. If the price settles below 1.0750, a subsequent decline to the level of 1.0700 is possible. The recovery scenario of EUR/USD requires the price to return above the level of 1.0800, which could trigger a gradual increase in the volume of long positions.
If the bears want to push GBP/USD even lower, the price must settle below the level of 1.2500 despite the signal that the pound sterling is oversold. Otherwise, the current pivot level could be interpreted as support, which could lead to an increase in the volume of long positions and, therefore, a partial recovery in the British pound's rate.
The candlestick chart type consists of graphic rectangles in white and black with lines at the top and bottom. With a detailed analysis of each individual candle, you can see its characteristics relative to a particular period: opening price, closing price, maximum and minimum price.
Horizontal levels are price coordinates relative to which a price may stop or revered its trajectory. In the market, these levels are called support and resistance.
Circles and rectangles are highlighted examples where the price developed. This color highlighting indicates horizontal lines that may put pressure on the price in the future.
Up/down arrows are guidelines for possible price direction in the future.
*这里的市场分析是为了增加您对市场的了解,而不是给出交易的指示。
InstaSpot分析评论将让您充分了解市场趋势! 作为InstaSpot的客户,您将获得大量的免费服务以实现有效的交易。


