


The legend in the InstaSpot team!
Legend! You think that's bombastic rhetoric? But how should we call a man, who became the first Asian to win the junior world chess championship at 18 and who became the first Indian Grandmaster at 19? That was the start of a hard path to the World Champion title for Viswanathan Anand, the man who became a part of history of chess forever. Now one more legend in the InstaSpot team!


Borussia is one of the most titled football clubs in Germany, which has repeatedly proved to fans: the spirit of competition and leadership will certainly lead to success. Trade in the same way that sports professionals play the game: confidently and actively. Keep a "pass" from Borussia FC and be in the lead with InstaSpot!
GOLD
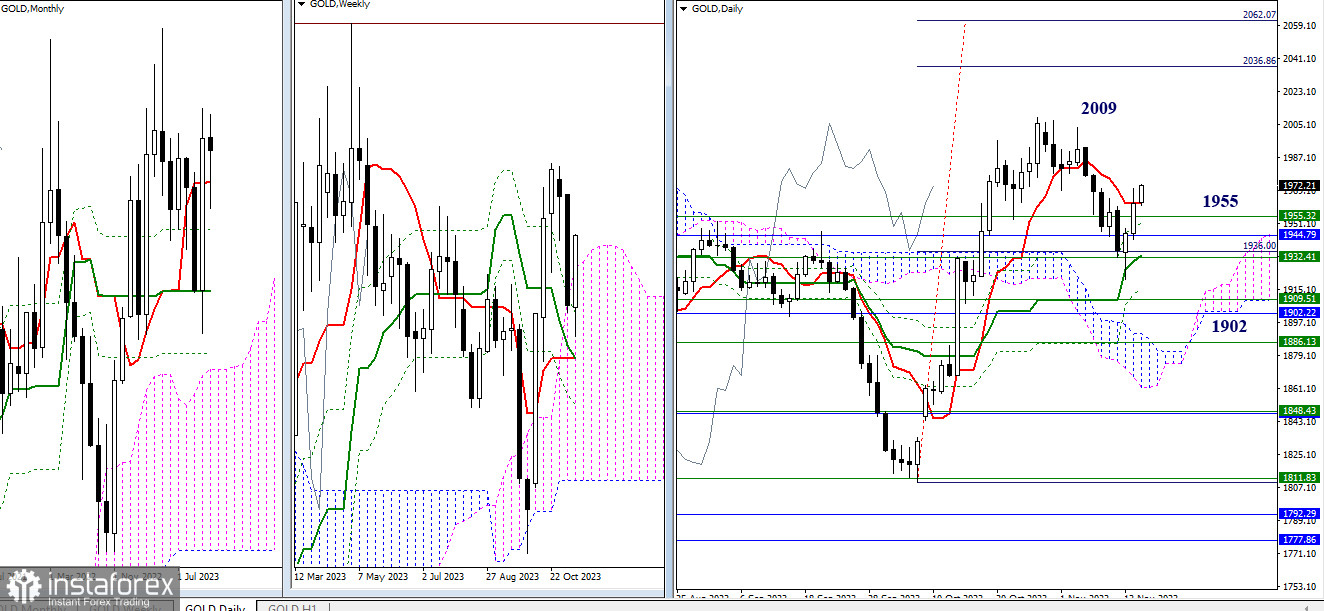
After testing the support of the monthly medium-term trend and the weekly cloud, gold actively sought to restore bullish positions throughout October. Much was achieved, but with the beginning of November, bearish players took the initiative and started developing the decline.
Some levels, previously surpassed by bullish players, now serve as the nearest supports. Interaction with the zone of 1926 – 1955 (daily medium-term trend + monthly short-term trend + upper boundary of the weekly cloud) led to the formation of a rebound. The daily rebound received confirmation, so the bulls' task now, based on the daily result, is to implement a rebound on the weekly timeframe. In case of success, further strengthening of bullish sentiments will be oriented towards exiting the correction zone (2009), with subsequent execution of the bullish target for breaking the daily Ichimoku cloud (2037 – 2062).
Failure of bullish players will put the opponent in charge of eliminating the daily golden cross, the final level of which is currently located at 1916, as well as returning under the support of the monthly short-term trend (1902), all of which will contribute to consolidation in the weekly cloud. By completing these tasks, bears will aim to neutralize all the achievements of their opponent in October.
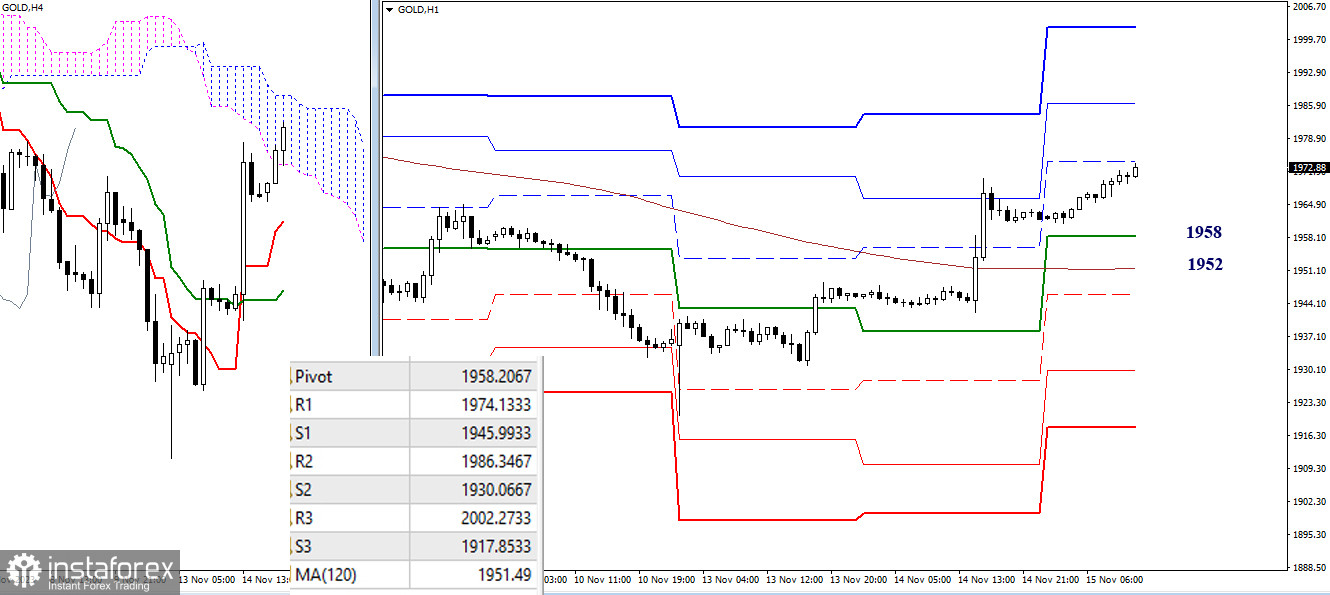
Earlier, the formation of a daily rebound allowed bulls to securely gain an advantage on lower timeframes. Now they are close to overcoming the resistance of the cloud on H4, with the result being a new bullish target—the target for breaking the H4 cloud. In addition, for the current development of the situation within the day, the resistances of classic pivot points act as benchmarks. Currently, R1 (1974) is being tested, followed by R2 (1986) and R3 (2002). The key levels in the current situation serve as supports. Today, they are ready to defend bullish interests and advantages in the area of 1958 (central pivot point of the day) – 1952 (weekly long-term trend).
The technical analysis of the situation uses:
Higher timeframes - Ichimoku Kinko Hyo (9.26.52) + Fibo Kijun levels
H1 - Pivot Points (classic) + Moving Average 120 (weekly long-term trend)
*这里的市场分析是为了增加您对市场的了解,而不是给出交易的指示。
InstaSpot分析评论将让您充分了解市场趋势! 作为InstaSpot的客户,您将获得大量的免费服务以实现有效的交易。


