


我们的团队有超过700万的操盘手!
我们每天都在一起努力改善交易。我们得到了很高的成绩,并继续前进。
世界各地数以百万计的操盘手的认可是我们工作的最大赞赏! 您做出了您的选择,我们将尽一切努力来满足您的期望!
我们是一个共同的伟大团队!
InstaSpot. 自豪地为您工作!


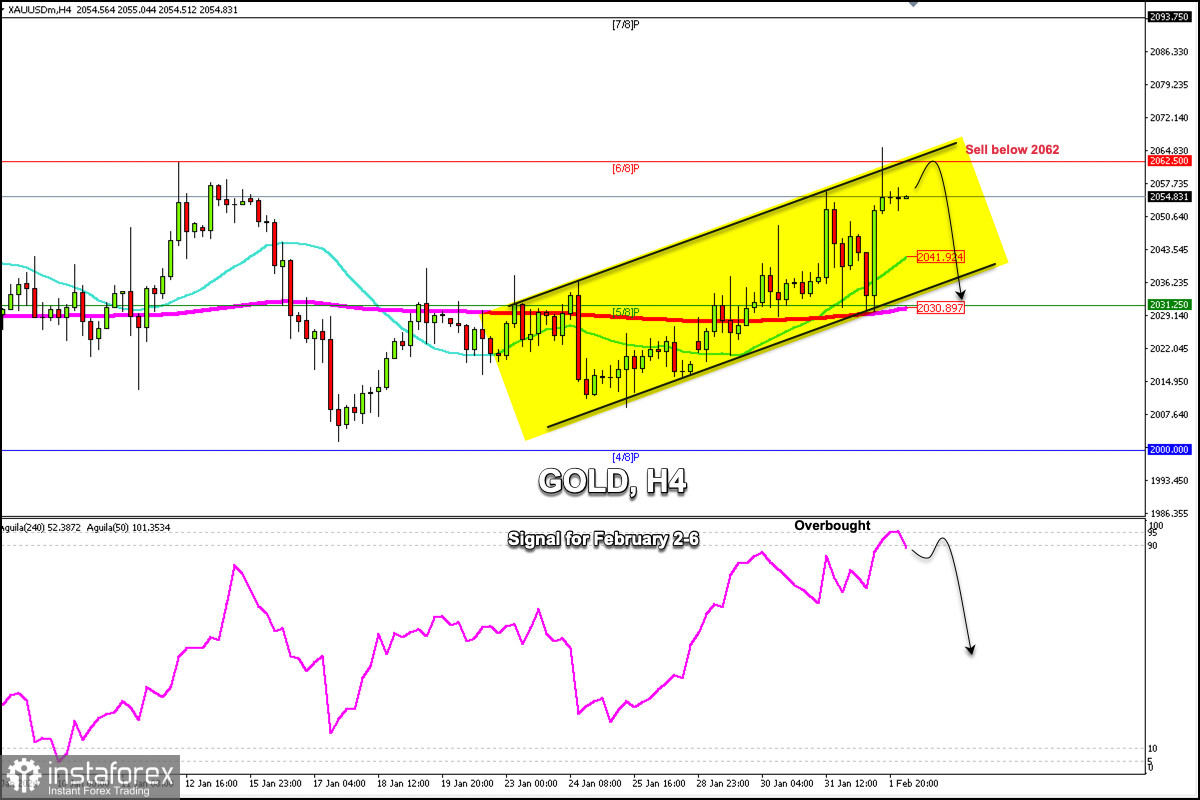
Gold is trading around 2,053.35, below 2/8 Murray, and above the moving averages of 200 and 21. Yesterday during the American session, gold bounced strongly above the 200 EMA and above 5/8 Murray after the US data.
On the H4 chart, we can see that gold is trading within the uptrend channel forming since January 24. In the next few hours, the metal is likely to continue its rise but could face strong resistance located around 2,062.
Technically, gold is strongly overbought. So, if it fails to consolidate above 2,063 in the coming days, it could be seen as a signal to sell with the target at 2,041 area (21 SMA). Additionally, if there is a sharp break in the uptrend channel, the instrument could cover the GAP that it left on January 26 around 2,018.
Yesterday during the European session, gold fell sharply but the 200 EMA gave it strong support. After the price had hit the bottom of the bullish trend channel, it gained strong momentum, achieving an accumulation of more than $30 in profit until reaching the weekly high of 2,065. This is a sign that gold could continue to rise in the coming days.
We believe that gold could make a technical correction in the next few hours and could find first support around 2,041. In case this level is broken, gold should find strong support at 2,030. In case gold breaks below this area, the price could have a bearish acceleration. Thus, the instrument could reach the psychological level of $2,000 in the coming days.
Meanwhile, we believe that any technical bounce and as long as gold trades above 2,035 will be seen as a signal to buy. Gold will come under bearish pressure below 2,062 and below 2,030.
*这里的市场分析是为了增加您对市场的了解,而不是给出交易的指示。
InstaSpot分析评论将让您充分了解市场趋势! 作为InstaSpot的客户,您将获得大量的免费服务以实现有效的交易。


