


我们的团队有超过700万的操盘手!
我们每天都在一起努力改善交易。我们得到了很高的成绩,并继续前进。
世界各地数以百万计的操盘手的认可是我们工作的最大赞赏! 您做出了您的选择,我们将尽一切努力来满足您的期望!
我们是一个共同的伟大团队!
InstaSpot. 自豪地为您工作!


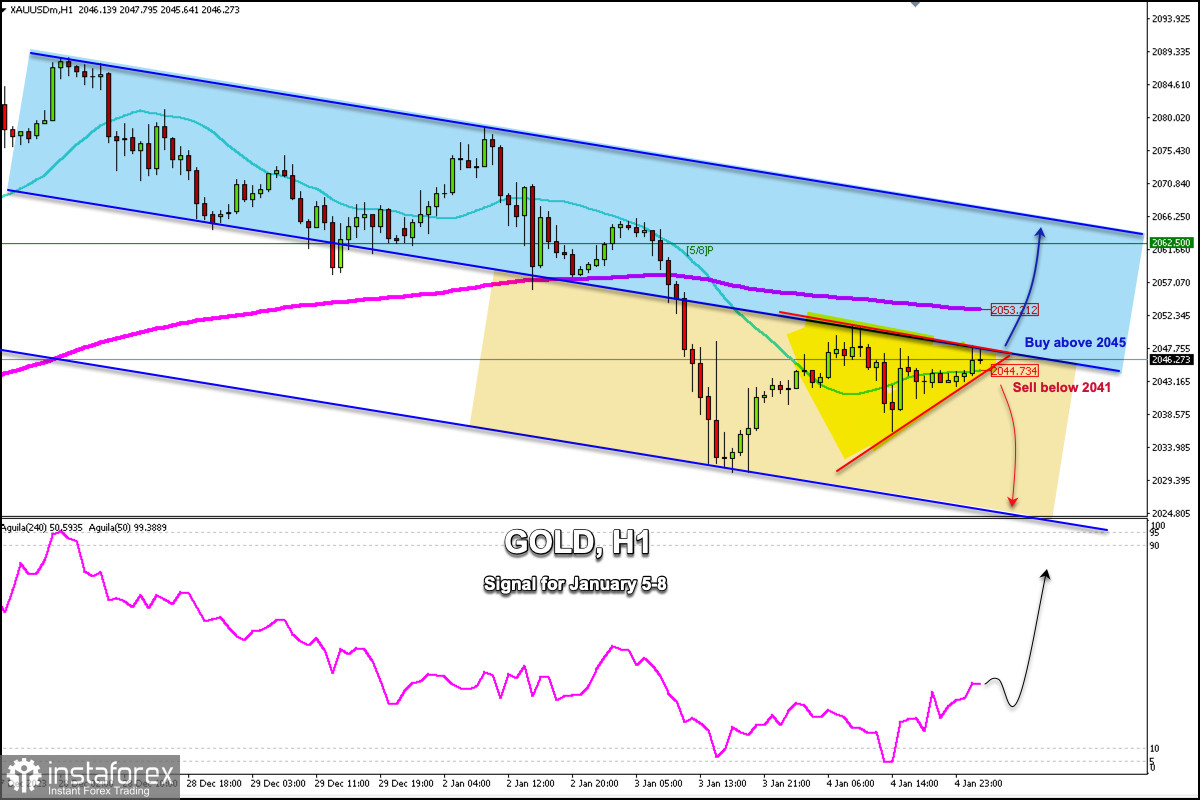
Early in the European session, gold was trading around 2,046.27, above the 21 SMA and below the 200 EMA. On the H1 chart, we can see that gold rebounded after reaching the area of 2,030. Now, it is showing a positive outlook but it is facing the top of the downtrend channel formed on December 27th.
Yesterday, data from pollster ADP on US job creation reported that 164,000 jobs were added, much more than the 115,000 expected by analysts. This favored the US dollar and as a result, we saw a technical correction in gold, but due to oversold conditions, it resumed its upward cycle.
If in the next hours, the XAU/USD remains above 2,044 it could continue to rise and it could reach 2,053 and it could even reach 5/8 Murray located at 2,062, and finally the top of the main downtrend channel around 2,065.
On the other hand, if gold falls below 2,041, we could expect a continuation of the downward movement and it could reach 2,030 and even the psychological level of $2,000 (4/8 Murray).
On the chart, we can see the formation of a symmetrical triangle pattern whose breakout could give us a signal to trade in the next hours.
The eagle indicator on January 4 reached 5 points which represents oversold conditions and gold is likely to continue rising in the coming hours if it consolidates above 2,043.
*这里的市场分析是为了增加您对市场的了解,而不是给出交易的指示。
InstaSpot分析评论将让您充分了解市场趋势! 作为InstaSpot的客户,您将获得大量的免费服务以实现有效的交易。


