


我们的团队有超过700万的操盘手!
我们每天都在一起努力改善交易。我们得到了很高的成绩,并继续前进。
世界各地数以百万计的操盘手的认可是我们工作的最大赞赏! 您做出了您的选择,我们将尽一切努力来满足您的期望!
我们是一个共同的伟大团队!
InstaSpot. 自豪地为您工作!


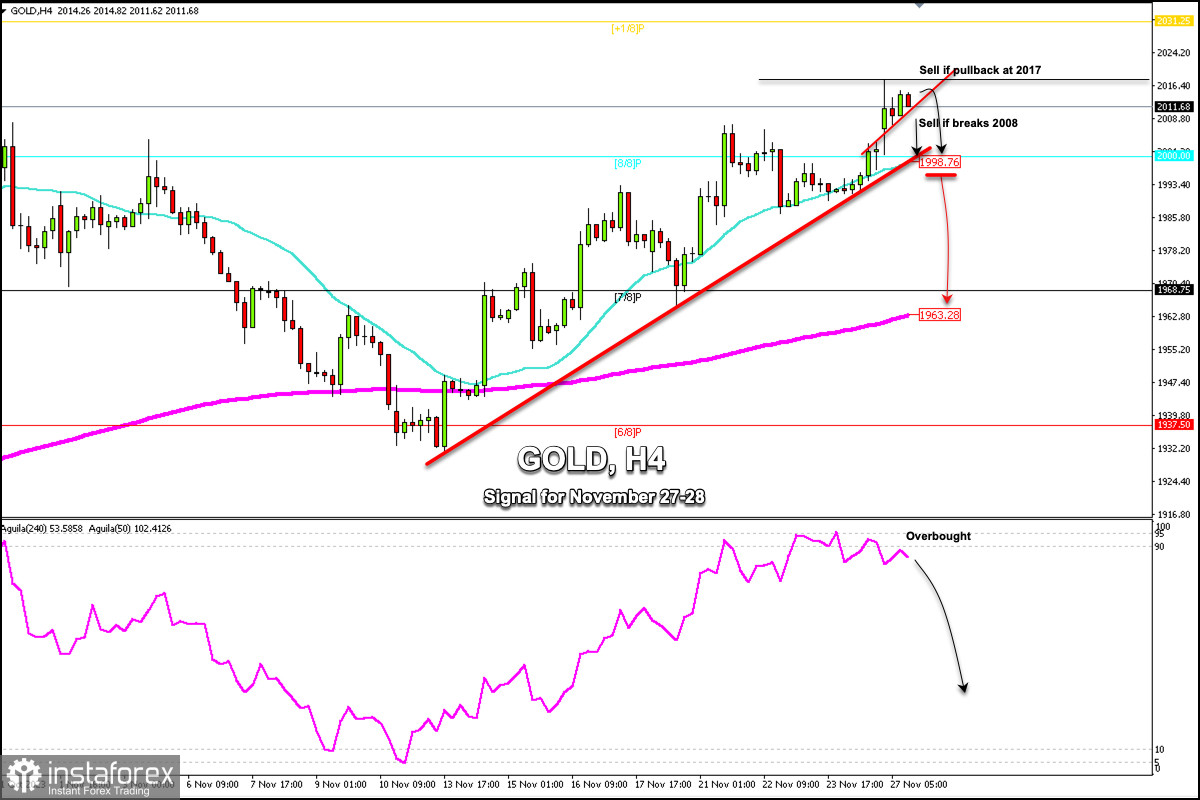
Gold extended its bullish move towards the psychological level, managing to close last week above the key $2,000 barrier. The opening of trading this week, due to low liquidity gave gold a strong bullish boost reaching the 2,017.90 high. This bullish move favors a further uptrend but could be showing signs of exhaustion. So, a technical correction could occur if the price falls below 2,008.
Gold is showing signs of a probable technical correction, but to sell, we should wait for a break below the daily R_2 which has now become a support located around 2,008. This would also mean a break of the small uptrend channel that is formed on H1 charts which could favor a technical correction towards the 21 SMA located at 1,998.
On the other hand, in case there is a pullback towards the daily R_3 located at 2,017, this could favor an opportunity to sell around this level with the target at 1,998.
If in the next few days, gold breaks the uptrend channel formed since November 10th and breaks below the psychological level of $2,000 and below the 21 SMA, we could expect a change in gold's trend.
If this scenario occurs, the metal could reach 7/8 Murray around 1,968 and could even reach the 200 EMA located at 1,963.
Since November 23, the eagle indicator has been giving an overbought signal. A strong correction is likely to follow occur in the next few days which could be seen as an opportunity to sell.
*这里的市场分析是为了增加您对市场的了解,而不是给出交易的指示。
InstaSpot分析评论将让您充分了解市场趋势! 作为InstaSpot的客户,您将获得大量的免费服务以实现有效的交易。


