


EUR/USD
Analysis:
The analysis of the weekly scale chart of the major European currency pair shows the formation of an ascending wave that began in September last year. An impulse type forms the wave. The correctional section (B) is formed as a shifting plane, developing along strong support. The wave structure still needs to be completed. There are no prerequisites for a change in trend direction soon.
Forecast:
At the beginning of the upcoming week, flat movement with a bearish vector is most likely. In calculating resistance, it is possible to expect the formation of a reversal and the resumption of movement along the main course. The resistance zone demonstrates the most likely area for completing the pair's weekly movement.
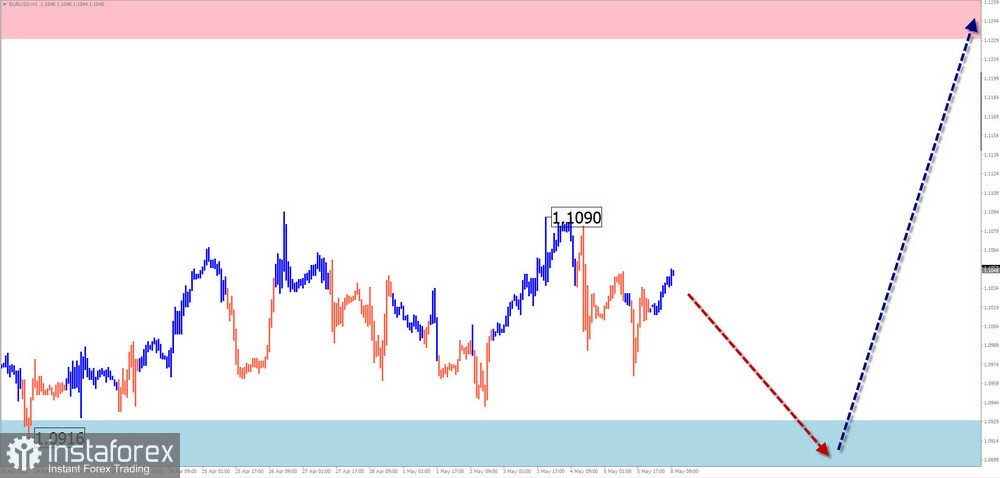
Potential reversal zones
Resistance:
Support:
Recommendations:
Selling: Short-term trades with a reduced lot will be possible in the coming days.
Buying: In calculating resistance, it is possible to start tracking reversal signals from your used trading systems for selling the instrument.
USD/JPY
Analysis:
The large-scale chart of the main Japanese yen pair demonstrates a downward zigzag wave that started in October last year. The middle part (B) of its structure is nearing completion. The quotes have reached the lower boundary of the powerful potential reversal zone. The downward section from May 2 has reversal potential.
Forecast:
At the beginning of the upcoming week, there is a high probability of price movement in the corridor between the nearest opposing zones. After probable pressure on the resistance zone, a transition to sideways drift is expected. By the end of the week, the resumption of bearish sentiment and a decline up to the lower support boundary can be anticipated.
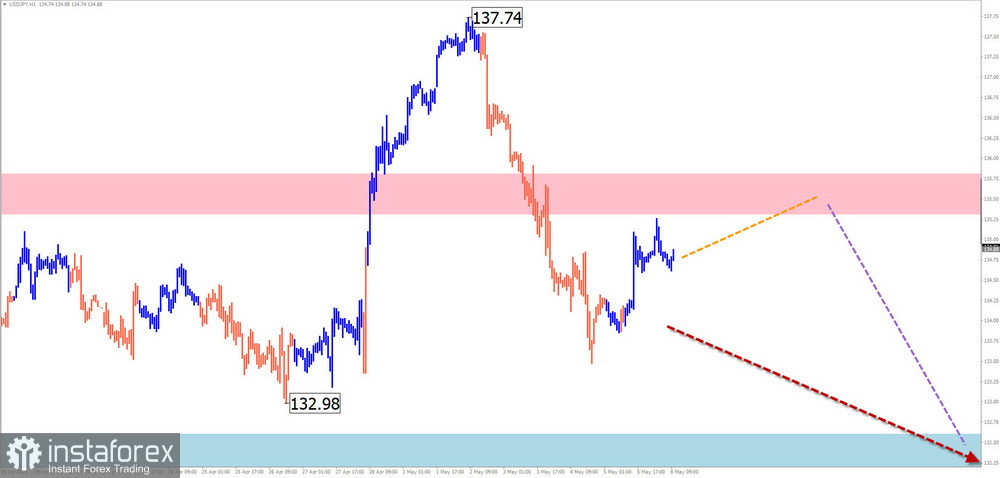
Potential reversal zones:
Resistance:
Support:
Recommendations:
Purchases: carry increased risk and may result in a loss to your deposit. It is optimal to abstain from trading until the completion of the upcoming upward retracement.
Sales: this will become possible after the appearance of reversal signals in your trading systems in the resistance zone area.
GBP/JPY
Analysis:
An upward wave has determined the movement direction of the British pound/Japanese yen pair since the end of September 2022. On the weekly TF, it completes a larger upward wave. Since the beginning of the current year, the quotes have formed the final part (C). The downward section from May 1 has reversal potential and might be the beginning of a correction of the main wave.
Forecast:
In the coming days, flat movement is expected, with a gradual decline in quotes to the support zone area. In the following days, a sharp increase in volatility, a reversal, and a resumption of the price increase are expected. A temporary puncture of the lower support boundary is not excluded during the change in direction.
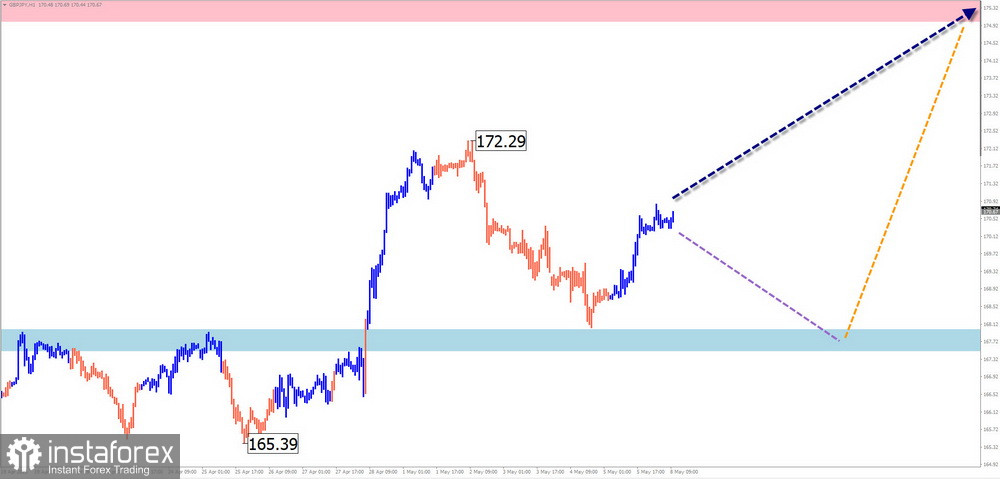
Potential reversal zones:
Resistance:
Support:
Recommendations:
Purchases: The main focus is searching for signals to buy in the support zone area.
Sales: In the coming days, they may become risky and are not recommended.
USD/CAD
Analysis:
Since the end of September last year, a downward wave has been determining the direction of the Canadian dollar's price movement in the main pair. The pair's quotes mostly moved in a sideways direction. The wave structure appears incomplete, lacking a final section (C).
Forecast:
The most probable scenario for the price movement in the coming days will be a gradual shift in the sideways plane between the nearest opposing zones. After a possible rebound of the price to the upper boundary of the corridor, a gradual decline in quotes to the support area can be expected.
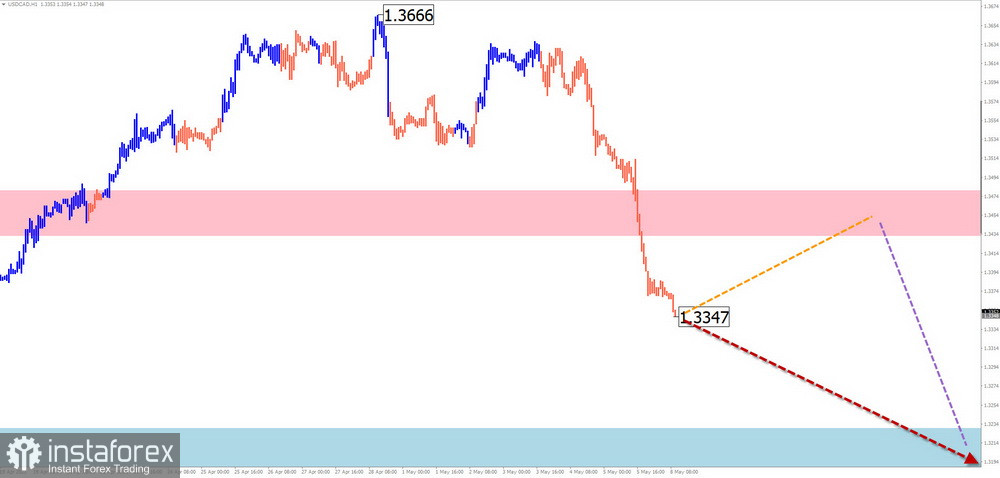
Potential reversal zones:
Resistance:
Support:
Recommendations:
Purchases: high risk, may lead to losses.
Sales: can be used with a fractional lot within individual trading sessions.
NZD/USD
Brief Analysis:
The unfinished wave construction of the New Zealand dollar chart is directed northward on the price chart. It counts from the end of September last year. The wave structure's middle part (B) continues to form, appearing as a horizontal plane. The quotes are approaching the lower boundary of a powerful potential reversal zone on a large TF.
Week Forecast:
A gradual movement of the price to the resistance zone area is expected throughout the upcoming weekly period. After reaching the calculated resistance zone, there is a high probability of a downward retracement of the quotes, not lower than the support zone.
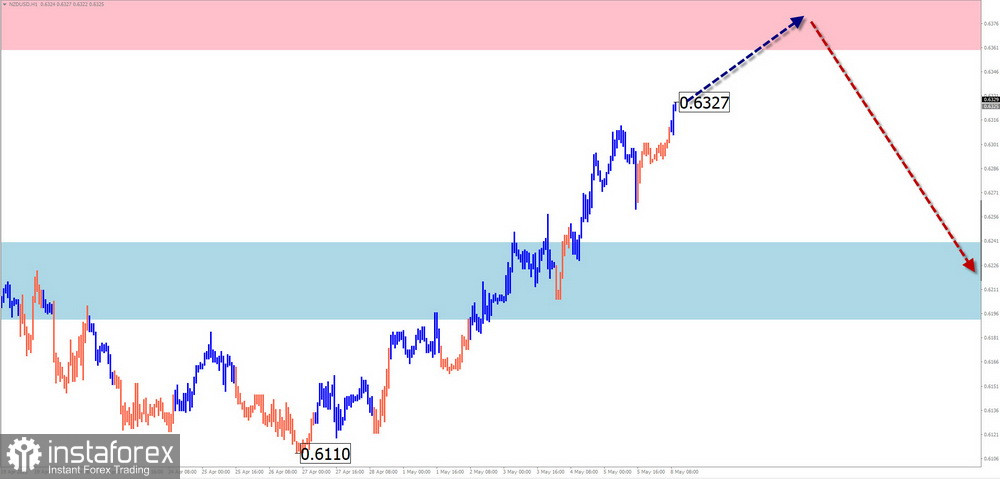
Potential reversal zones:
Resistance:
Support:
Recommendations:
Sales: have low potential, can be used as "scalping."
Purchases: After confirmed reversal signals appear in the support zone area, they can become the main direction for trading this pair.
Gold
Analysis:
A downward wave algorithm has set the gold chart's short-term trend direction since August 2020. The wave develops in the form of an extended plane. Its final section started in September of last year. Since the beginning of last month, the quotes are forming a complex counter-correction. At the time of analysis, it appears incomplete.
Forecast:
In the coming days, the instrument's price should complete the corrective phase of the movement, with a decline to support levels. By the end of the upcoming week, a subsequent reversal and price growth toward the resistance zone is probable. Breaking the boundaries of the designated price corridor is possible but unlikely.
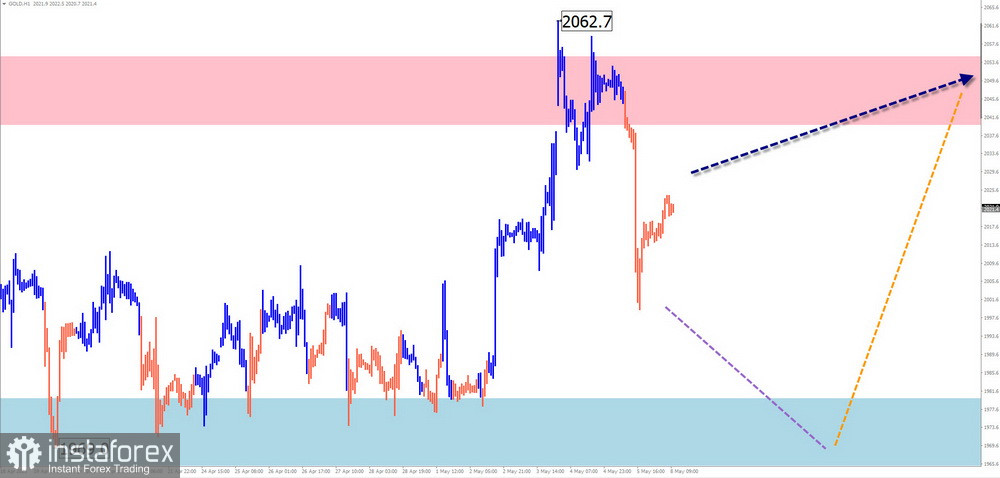
Potential reversal zones:
Resistance:
Support:
Recommendations:
Purchases will be possible after suitable signals appear in the support zone area.
Sales: are allowed with a reduced lot within "intraday" fractional lots.
Explanations: In simplified wave analysis (SWA), all waves consist of 3 parts (A-B-C). The last incomplete wave is analyzed on each TF. Dotted lines indicate expected movements.
Attention: The wave algorithm does not consider the duration of instrument movements over time!
*这里的市场分析是为了增加您对市场的了解,而不是给出交易的指示。
InstaSpot分析评论将让您充分了解市场趋势! 作为InstaSpot的客户,您将获得大量的免费服务以实现有效的交易。


