


The legend in the InstaSpot team!
Legend! You think that's bombastic rhetoric? But how should we call a man, who became the first Asian to win the junior world chess championship at 18 and who became the first Indian Grandmaster at 19? That was the start of a hard path to the World Champion title for Viswanathan Anand, the man who became a part of history of chess forever. Now one more legend in the InstaSpot team!


Borussia is one of the most titled football clubs in Germany, which has repeatedly proved to fans: the spirit of competition and leadership will certainly lead to success. Trade in the same way that sports professionals play the game: confidently and actively. Keep a "pass" from Borussia FC and be in the lead with InstaSpot!
Investors express concern about the labor market situation in the UK. The number of jobless claims rose by 28,200 in March, following declines of 21,500 and 18,800 in the previous two months. Over the past nine months, the number of unemployed has remained roughly stable, fluctuating around the 1.525 million mark. Unemployment levels within these limits persisted for a long time, from 2009 to 2013, when the country experienced a financial crisis. This means that the labor market has considerable room for improvement.
However, between December and February, the unemployment rate rose to 3.8% from 3.7%, as more people look for work amid rising inflation and the recovery from the pandemic. At the same time, wage growth excluding bonuses shows little sign of slowing at 6.6% year-on-year, and payment including bonuses stabilized around the level of 6%.
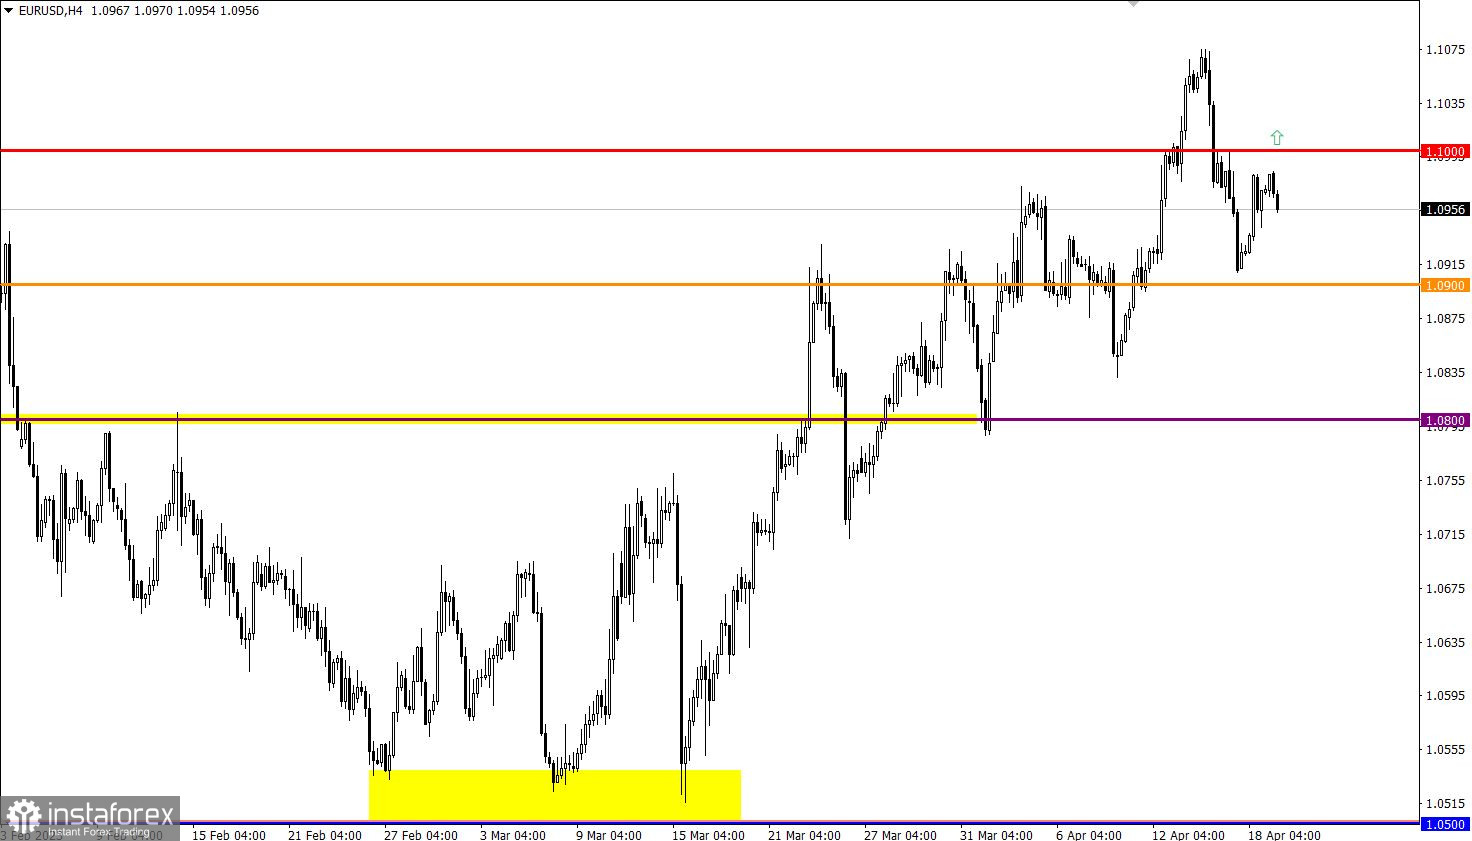
EUR/USD rose slightly after its recent decline but still trades below the 1.1000 level, indicating the presence of a corrective movement from the local high of the medium-term trend in the market.
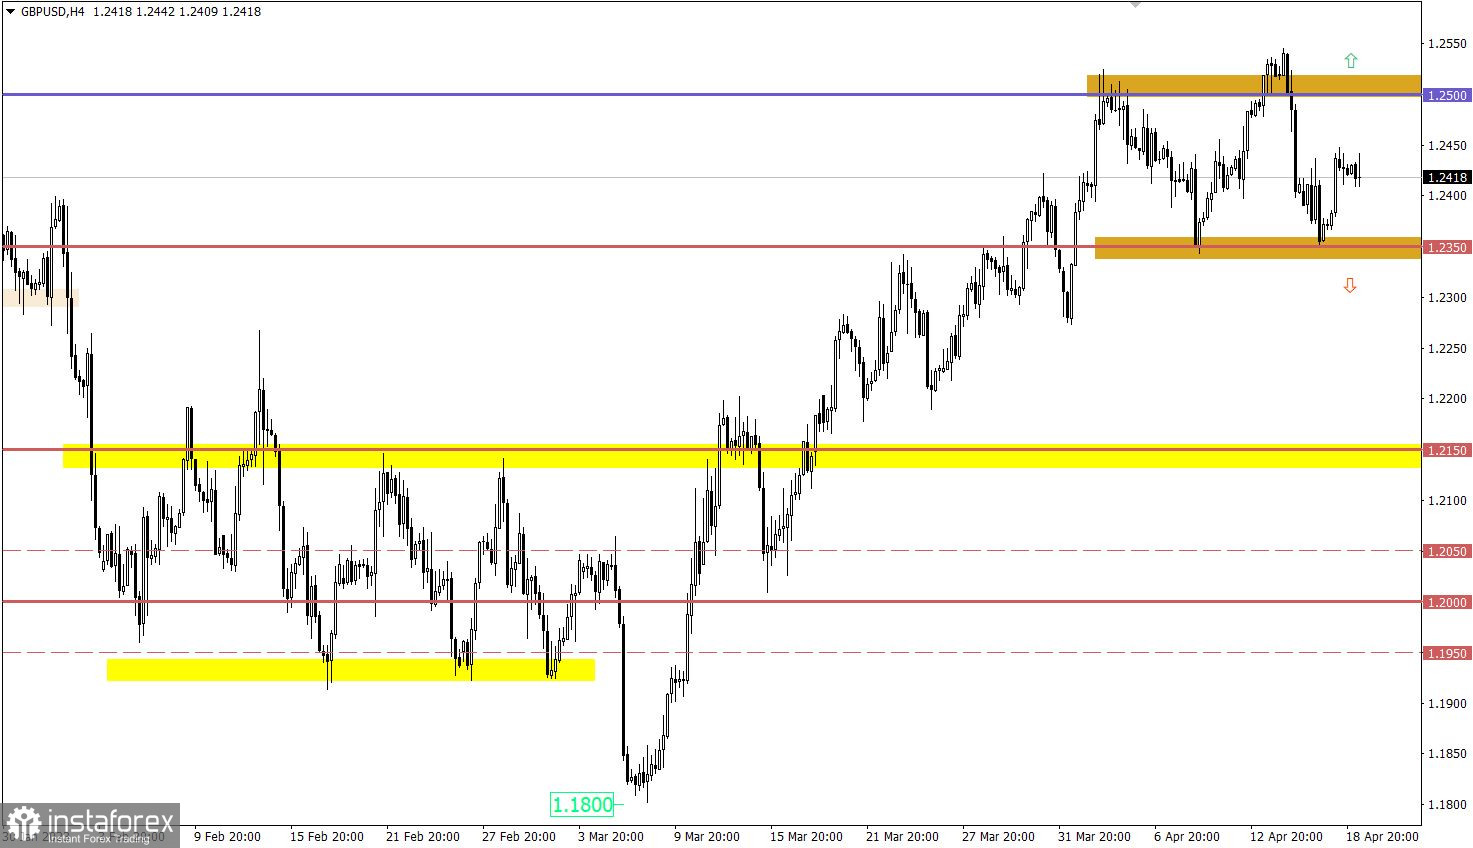
GBP/USD has recovered slightly after its recent decline. The level of 1.2350 continues to be a support for sellers, relative to which there was an increase in the volume of long positions.

At the beginning of the European session the UK inflation data was released, where the growth rate slowed from 10.4% to 10.1%, slightly higher than the economists' forecast of 9.8%. This data may push the Bank of England to continue the cycle of monetary policy tightening.
European Union inflation data is also expected to be released, where the market sees a slowdown in growth from 8.5% to 6.9%, according to preliminary estimates. These data may have been priced in already, but if they differ from the preliminary estimate, it may lead to speculative price jumps.
Time targeting:
EU Inflation – 09:00 UTC
Quotes will continue the corrective move until they exceed the level of 1.1000 in the 4-hour timeframe. In such a situation, traders are considering two possible scenarios: the first is a price rebound from the level of 1.1000, followed by an increase in the correction; the second scenario is a price retention above the level of 1.1000 with the prospect of updating the local high of the medium-term trend.
There is a sideways price fluctuation in the market since April, in the range of 1.2350/1.2500, where the upper limit has already been indirectly broken. The fact that a flat has appeared indicates a slowdown in the formation of an upward cycle, but it is not yet clear whether the medium-term upward trend has ended. From a technical analysis point of view, it is recommended to use the method of outgoing momentum from the current range, which can indicate the subsequent price movement.
The candlestick chart type is white and black graphic rectangles with lines above and below. With a detailed analysis of each individual candle, you can see its characteristics relative to a particular time frame: opening price, closing price, intraday high and low.
Horizontal levels are price coordinates, relative to which a price may stop or reverse its trajectory. In the market, these levels are called support and resistance.
Circles and rectangles are highlighted examples where the price reversed in history. This color highlighting indicates horizontal lines that may put pressure on the asset's price in the future.
The up/down arrows are landmarks of the possible price direction in the future.
*这里的市场分析是为了增加您对市场的了解,而不是给出交易的指示。
InstaSpot分析评论将让您充分了解市场趋势! 作为InstaSpot的客户,您将获得大量的免费服务以实现有效的交易。


