


我们的团队有超过700万的操盘手!
我们每天都在一起努力改善交易。我们得到了很高的成绩,并继续前进。
世界各地数以百万计的操盘手的认可是我们工作的最大赞赏! 您做出了您的选择,我们将尽一切努力来满足您的期望!
我们是一个共同的伟大团队!
InstaSpot. 自豪地为您工作!


Data on industrial production in the United Kingdom recorded a slowdown in the rate of decline from -3.2% to -3.1%. The revision of the previous figures from -4.3% to -3.2% had the most significant impact. The British pound reacted positively to the industrial data.
A similar indicator was published in the EU, where the growth rate of industrial production accelerated from 0.9% to 2.0%, with economists' forecast growth of only 1.2%. This positive factor stimulated the euro to grow further.
Data on U.S. jobless claims was also released, where they recorded a slight decrease in the overall indicator. The details of the statistics indicate that the volume of continuing claims for benefits fell from 1.823 million to 1.810 million, and initial claims rose from 228,000 to 239,000.
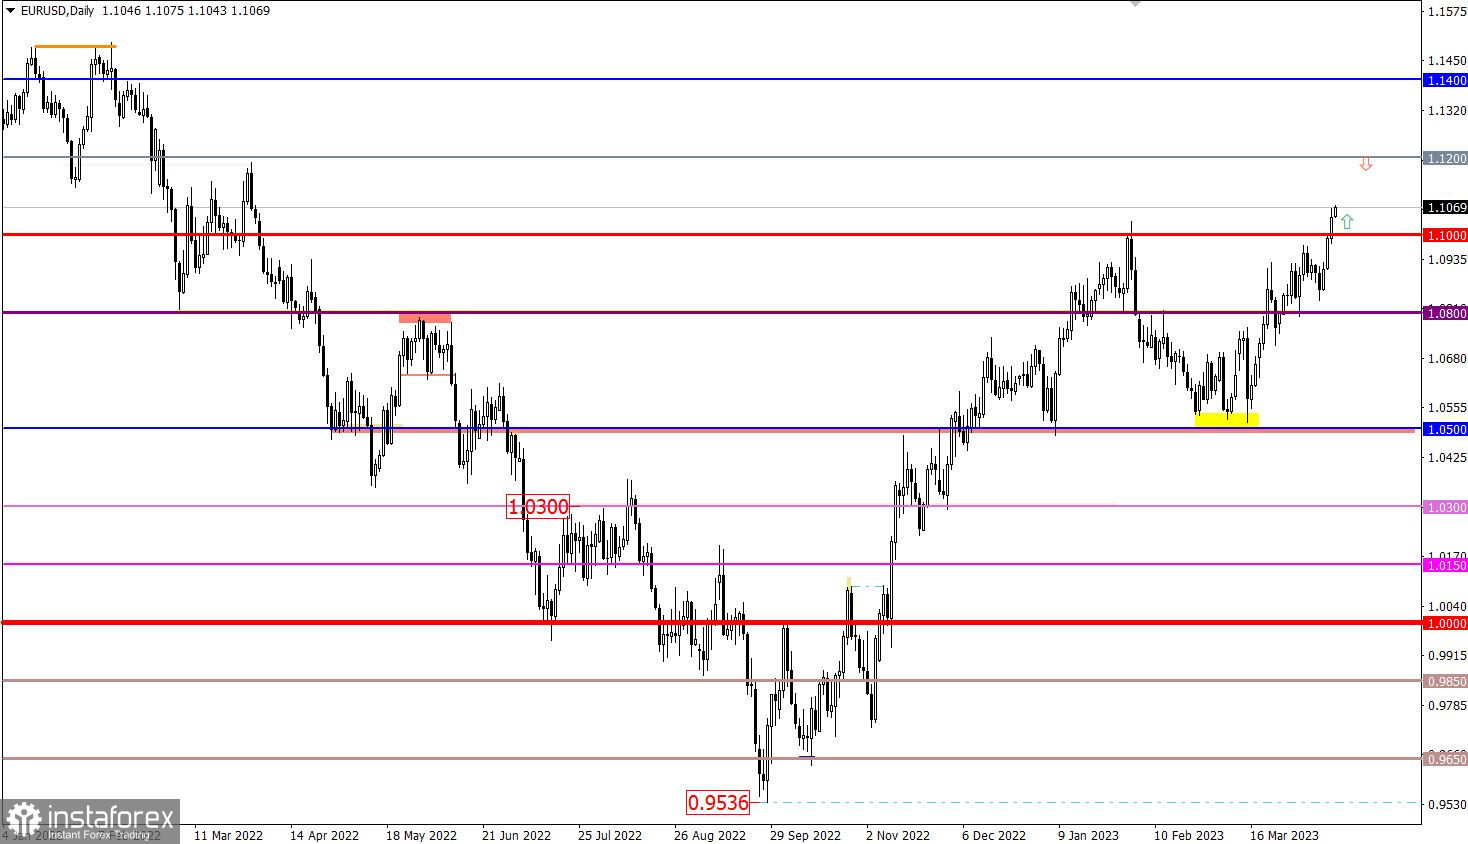
EUR/USD accelerated its growth after overcoming the 1.1000 psychological level. This led to an increase in the volume of long positions and inertial growth, during which technical signals of overbought were ignored.
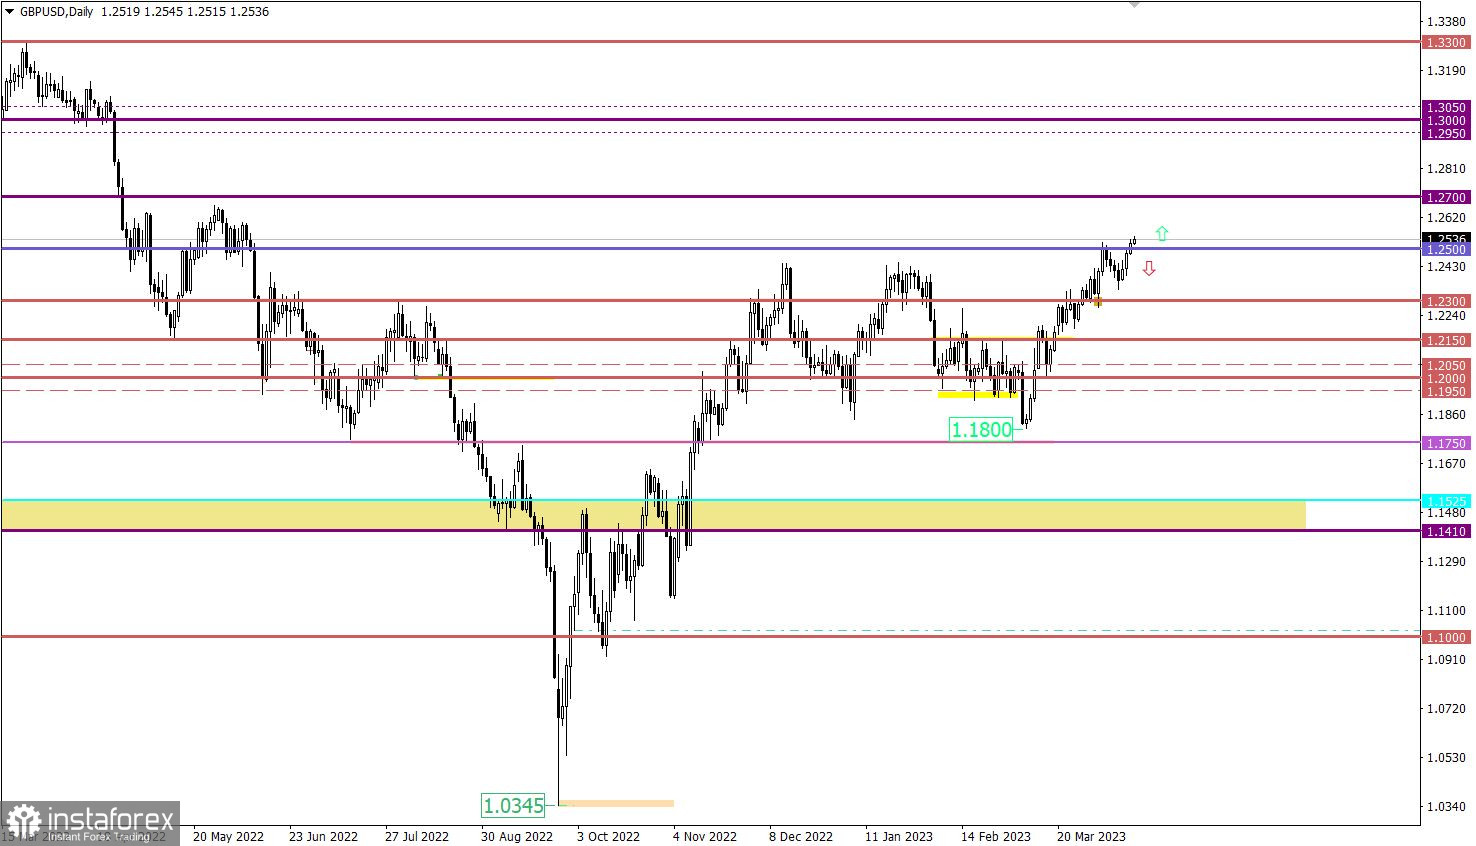
GBP/USD has stabilized above the 1.2500 resistance level, which indicates several important technical factors: firstly, the continuation of the medium-term upward trend, and secondly, an increase in the volume of long positions, which may contribute to further growth in the value of the pound sterling.

Today, investors will focus on retail sales data in the United States, where growth is expected to slow down from 5.4% to 3.2%. Not the most favorable statistics for the U.S. dollar.
Time targeting:
U.S. Retail Sales – 12:30 UTC
The next resistance level is in the 1.1200 area, which may slow down the current upward cycle. However, the expected corrective movement should not disrupt the medium-term upward trend.
The growth in the volume of long positions in the pound sterling may lead to a price movement in the area of interaction of trading forces 1.2670/1.2720, which will support the medium-term trend and allow for more significant price changes. At the same time, an alternative scenario in the form of a corrective pullback is possible, which will not violate the cyclicality of the medium-term trend.
The pullback may occur if the price returns below the 1.2500 level. However, the area of interaction of trading forces 1.2670/1.2720 may put pressure on long positions and cause a technical pullback.
The candlestick chart type is white and black graphic rectangles with lines above and below. With a detailed analysis of each individual candle, you can see its characteristics relative to a particular time frame: opening price, closing price, intraday high and low.
Horizontal levels are price coordinates, relative to which a price may stop or reverse its trajectory. In the market, these levels are called support and resistance.
Circles and rectangles are highlighted examples where the price reversed in history. This color highlighting indicates horizontal lines that may put pressure on the asset's price in the future.
The up/down arrows are landmarks of the possible price direction in the future.
*这里的市场分析是为了增加您对市场的了解,而不是给出交易的指示。
InstaSpot分析评论将让您充分了解市场趋势! 作为InstaSpot的客户,您将获得大量的免费服务以实现有效的交易。


