


我们的团队有超过700万的操盘手!
我们每天都在一起努力改善交易。我们得到了很高的成绩,并继续前进。
世界各地数以百万计的操盘手的认可是我们工作的最大赞赏! 您做出了您的选择,我们将尽一切努力来满足您的期望!
我们是一个共同的伟大团队!
InstaSpot. 自豪地为您工作!


Inflation in the United States fell to an annual rate of 5% in March, the lowest level since May 2021. Note that analysts had anticipated that inflation in March would be 5.2%. The difference between the expected and actual figure caused speculative fluctuations in financial markets.
Even though inflation is falling fast, economists believe that the Federal Reserve will still raise rates at the next meeting, as indicated by the minutes of the March meeting of the Federal Open Market Committee, published after the inflation data.
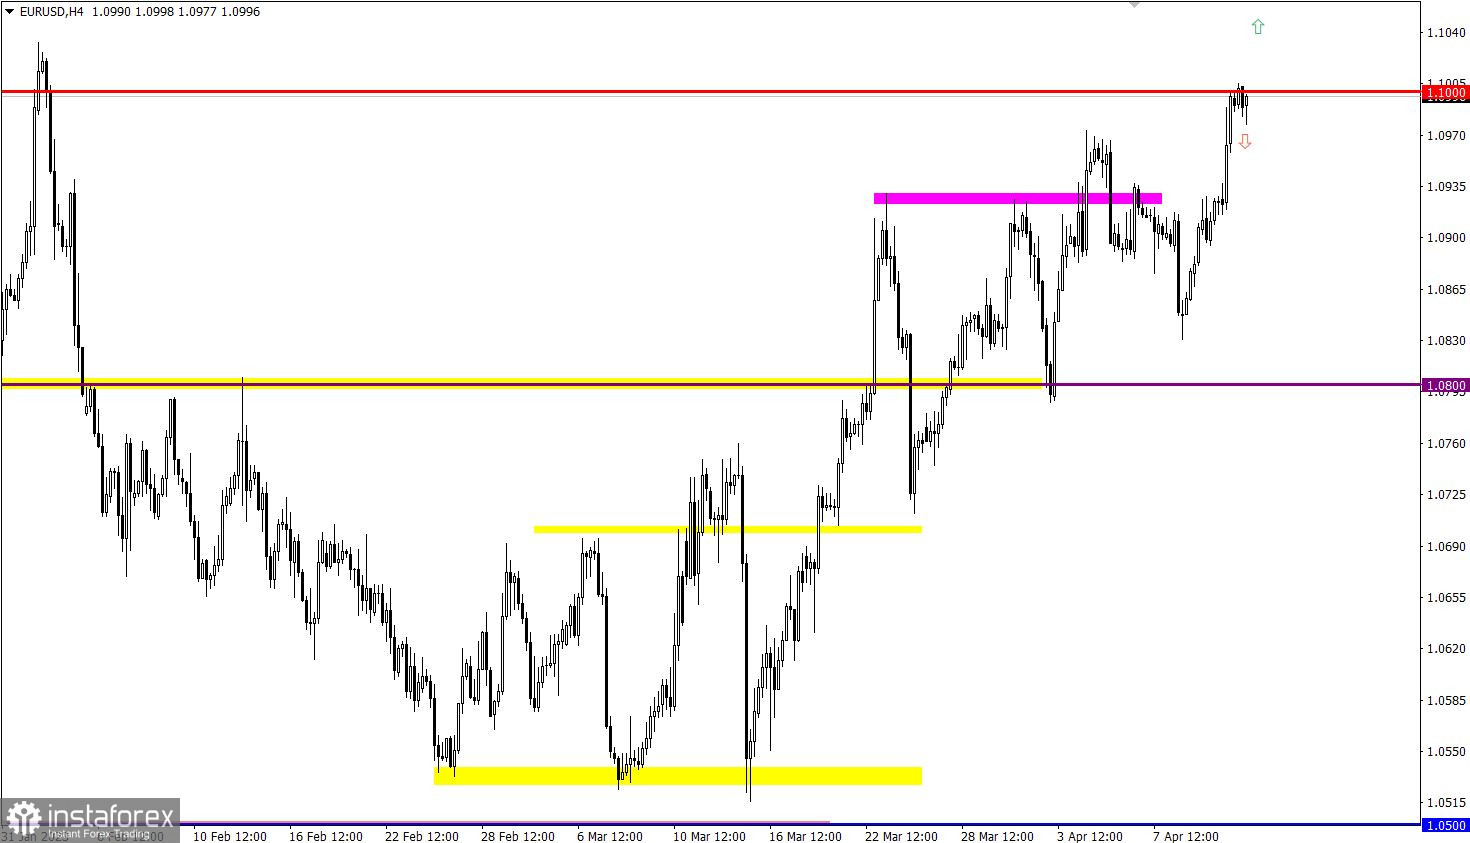
EUR/USD reached the 1.1000 psychological level during the rapid inertial movement. Given the latest price changes, there is a full recovery of the euro against the decline in February. This movement indicates a prevailing upward mood among market participants.
GBP/USD reached the 1.2500 resistance level, against which a corrective move appeared last week. The full recovery of the value of the pound sterling from the recent decline indicates an upward trend among traders.

The UK industrial production data was published, where the recession rate slowed down from -3.2% to -3.1%. The strongest impact was the revision of the previous figures from -4.3% to -3.2%. The pound reacted positively to the industrial data.
Eurozone industrial output is also expected, where growth is forecast to range from 0.9% to 1.5%. This is a positive factor which may strengthen the euro.
The U.S. jobless claims will also be published, where a slight decrease is anticipated in the overall indicator. Details of the statistics indicate that continuing claims could fall from 1,823,000 to 1,814,000, and initial claims could rise from 228,000 to 232,000.
Time targeting:
EU Industrial Production – 09:00 UTC
U.S. Jobless Claims – 12:30 UTC
In the current situation, a technical signal appeared on the market that the euro was overbought in the intraday period, which could lead to stagnation or a pullback. However, if the price remains stable above the 1.1000 level, then there is a possibility of continuation of the medium-term upward trend. In this case, traders can ignore the overbought technical signal and continue the further growth of the euro.
It can be assumed that a stable price retention above the 1.2500 level will prolong the medium-term upward trend. As for the stagnation or pullback relative to the resistance level, it is likely to become a short-term price change.
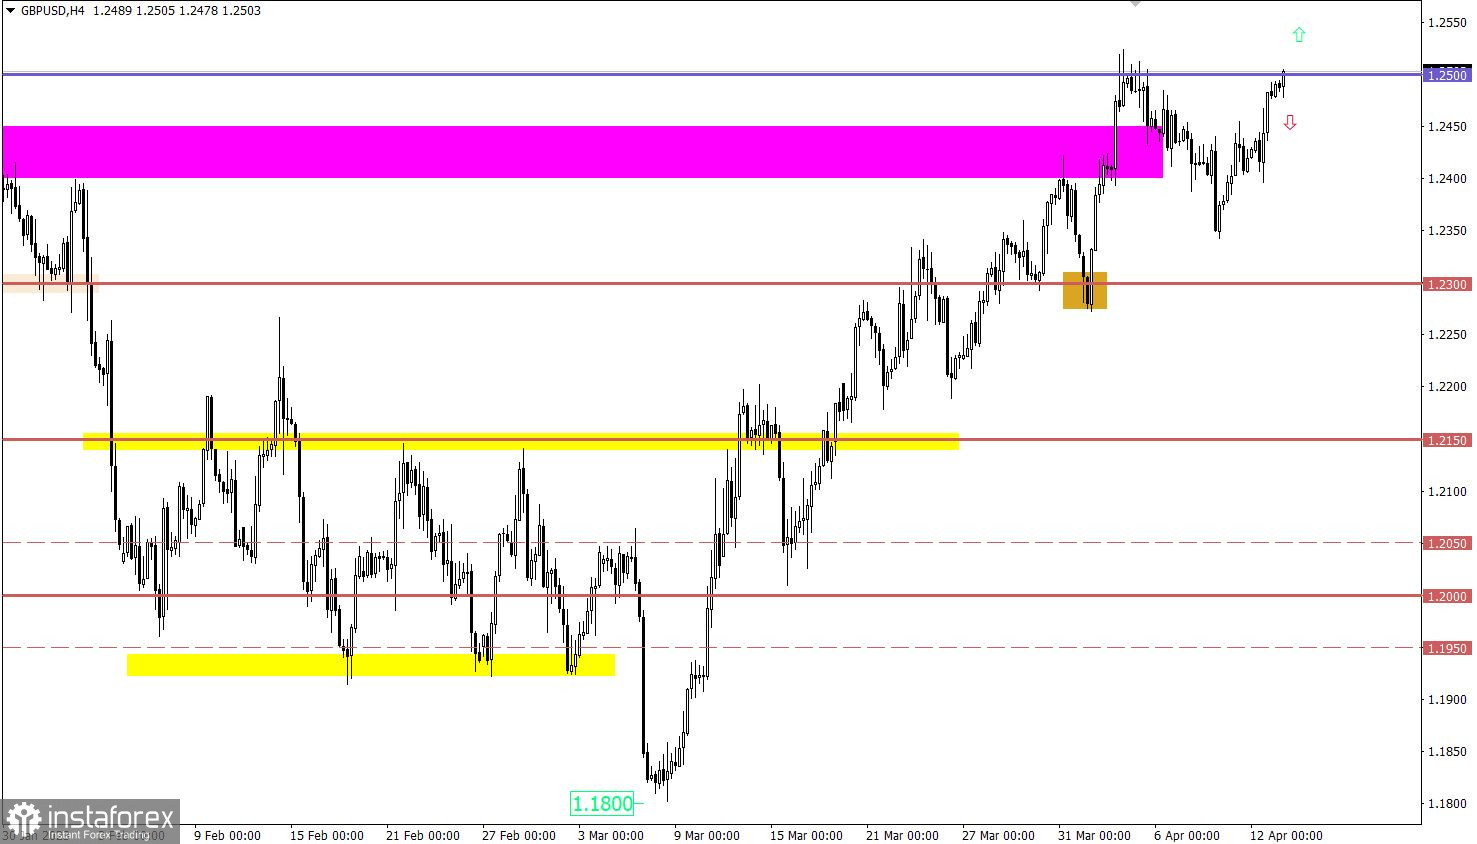
The candlestick chart type is white and black graphic rectangles with lines above and below. With a detailed analysis of each individual candle, you can see its characteristics relative to a particular time frame: opening price, closing price, intraday high and low.
Horizontal levels are price coordinates, relative to which a price may stop or reverse its trajectory. In the market, these levels are called support and resistance.
Circles and rectangles are highlighted examples where the price reversed in history. This color highlighting indicates horizontal lines that may put pressure on the asset's price in the future.
The up/down arrows are landmarks of the possible price direction in the future.
*这里的市场分析是为了增加您对市场的了解,而不是给出交易的指示。
InstaSpot分析评论将让您充分了解市场趋势! 作为InstaSpot的客户,您将获得大量的免费服务以实现有效的交易。


