


我们的团队有超过700万的操盘手!
我们每天都在一起努力改善交易。我们得到了很高的成绩,并继续前进。
世界各地数以百万计的操盘手的认可是我们工作的最大赞赏! 您做出了您的选择,我们将尽一切努力来满足您的期望!
我们是一个共同的伟大团队!
InstaSpot. 自豪地为您工作!


Data on jobless claims in the United States revealed a slight decrease in their number. Continuing claims increased to 1,823,000 from 1,817,000, while initial claims decreased to 228,000 from 246,000.
Meanwhile, previous results were upwardly revised, which caused concern among speculators. The number of initial and continuing claims was revised to 246,000 versus 195,000 and to 1,817,000 from 1,689,000 respectively.
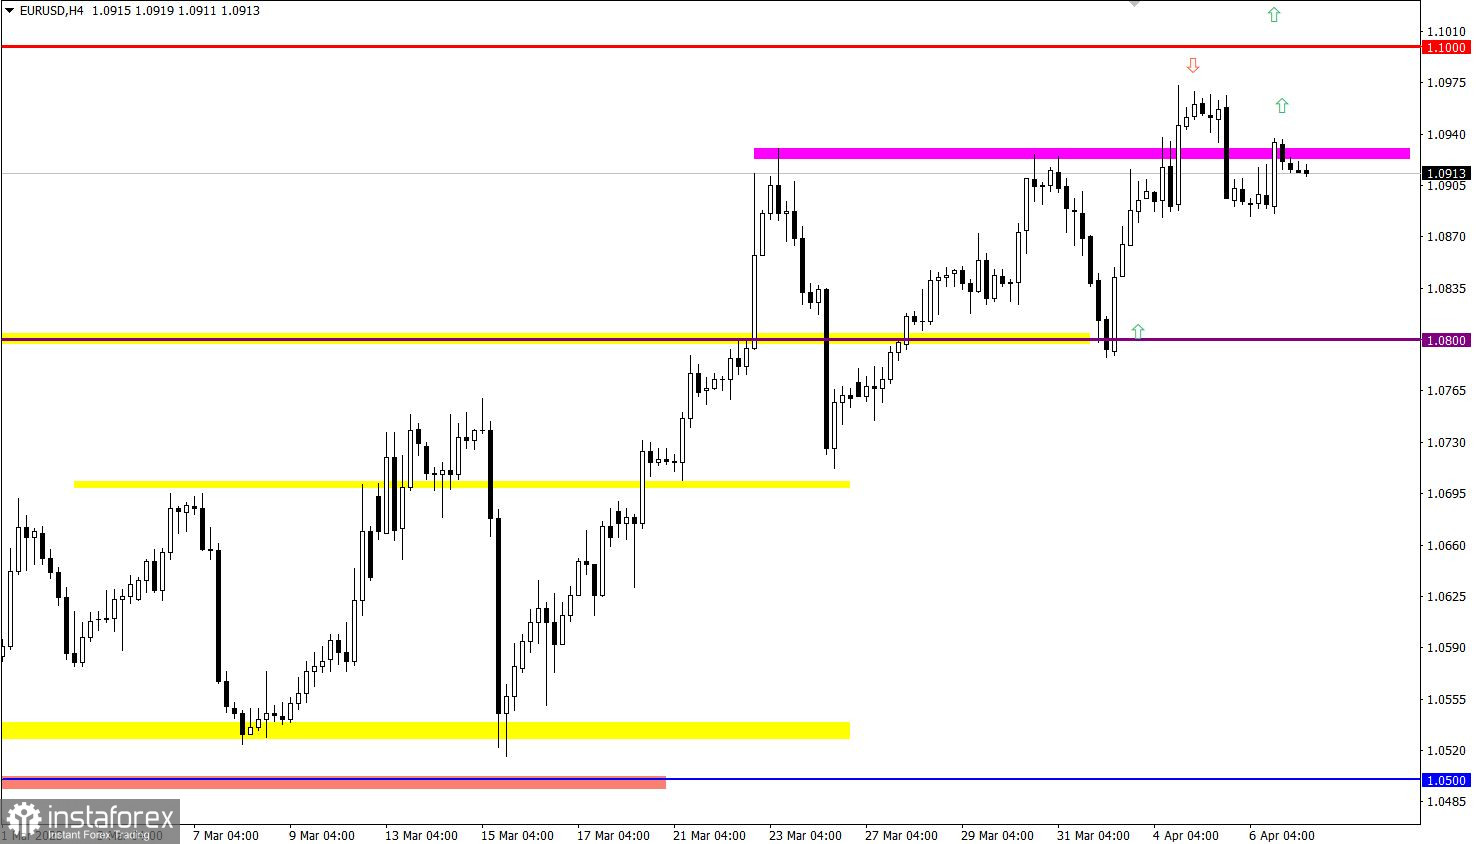
EUR/USD is in a correction phase after reaching a weekly high. Despite a modest correction, market sentiment is still bullish, as evidenced by an almost complete recovery of the euro after its decline in February.
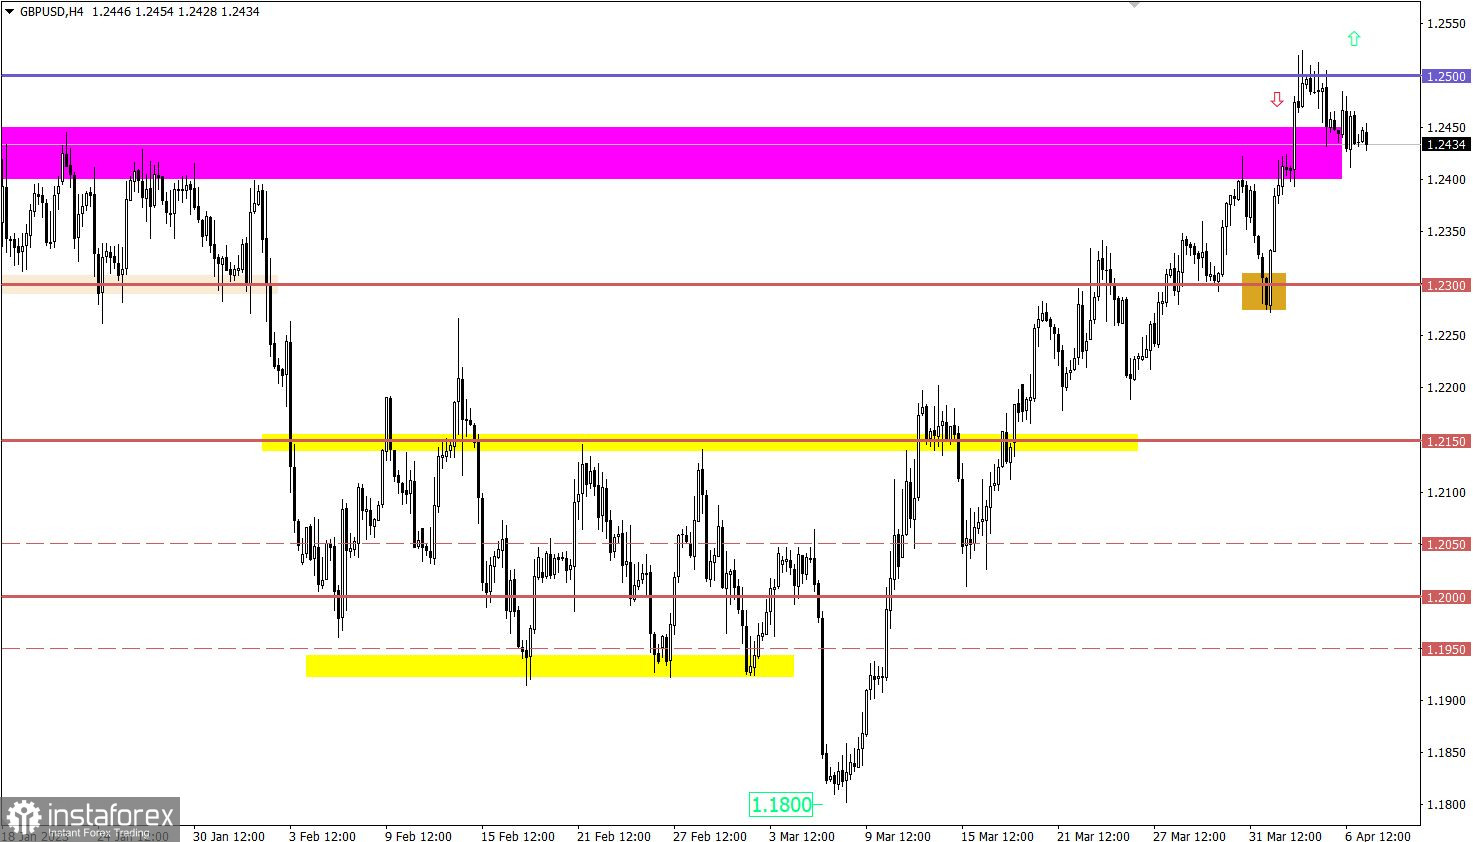
GBP/USD has slightly retreated after updating the swing high of the medium-term trend. The level of 1.2500 serves as resistance, where buying volumes decreased.

Today, the US Department of Labor will deliver a report, which would likely have a strong impact on the market and speculators. However, today is a holiday in both the US and Europe, so trading volumes will be reduced, and the reaction to the report will likely occur next week.
Unemployment is forecasted to remain at 3.6%. However, traders will focus on NonFarm Payrolls. In the previous month, the American economy added 311,000 jobs. This month, the economy is expected to add only 240,000 jobs. Although this is enough to maintain stability in the labor market, a significant slowdown in the pace of job creation will indicate a deteriorating situation, which will lead to a noticeable weakening of the US dollar.
The psychological level of 1.1000 still serves as resistance. Buying volumes have decreased near the barrier. In case of a breakout, we may see a continuation of the medium-term uptrend. Until then, the quote will be in a stage of correction or stagnation.
It can be assumed that a pullback illustrated a shift in trading forces. In such a case, buying volumes will likely grow, leading to a breakout through resistance at 1.2500. The main technical signal of an uptrend continuation is likely to come after consolidation above 1.2500 in the daily time frame. Until then, the price will be in a pullback-flat phase from resistance.
The candlestick chart shows graphical white and black rectangles with upward and downward lines. While conducting a detailed analysis of each individual candlestick, it is possible to notice its features intrinsic to a particular time frame: the opening price, the closing price, and the highest and lowest price.
Horizontal levels are price levels, in relation to which a stop or reversal of the price may occur. They are called support and resistance levels.
Circles and rectangles are highlighted examples where the price reversed in the course of its history. This color highlighting indicates horizontal lines which can exert pressure on prices in the future.
Upward/downward arrows signal a possible future price direction.
*这里的市场分析是为了增加您对市场的了解,而不是给出交易的指示。
InstaSpot分析评论将让您充分了解市场趋势! 作为InstaSpot的客户,您将获得大量的免费服务以实现有效的交易。


