


我们的团队有超过700万的操盘手!
我们每天都在一起努力改善交易。我们得到了很高的成绩,并继续前进。
世界各地数以百万计的操盘手的认可是我们工作的最大赞赏! 您做出了您的选择,我们将尽一切努力来满足您的期望!
我们是一个共同的伟大团队!
InstaSpot. 自豪地为您工作!


There were no significant events in the European Union, the United Kingdom and the United States on the macroeconomic calendar on Monday. In light of this, investors and traders turned their attention to the news flow. One of the important events was the speech of European Central Bank Governing Council member Isabel Schnabel. In her speech, she said they were not concerned about risks to financial stability and expressed the regulator's hawkish view on interest rates, which could lead to further increases.
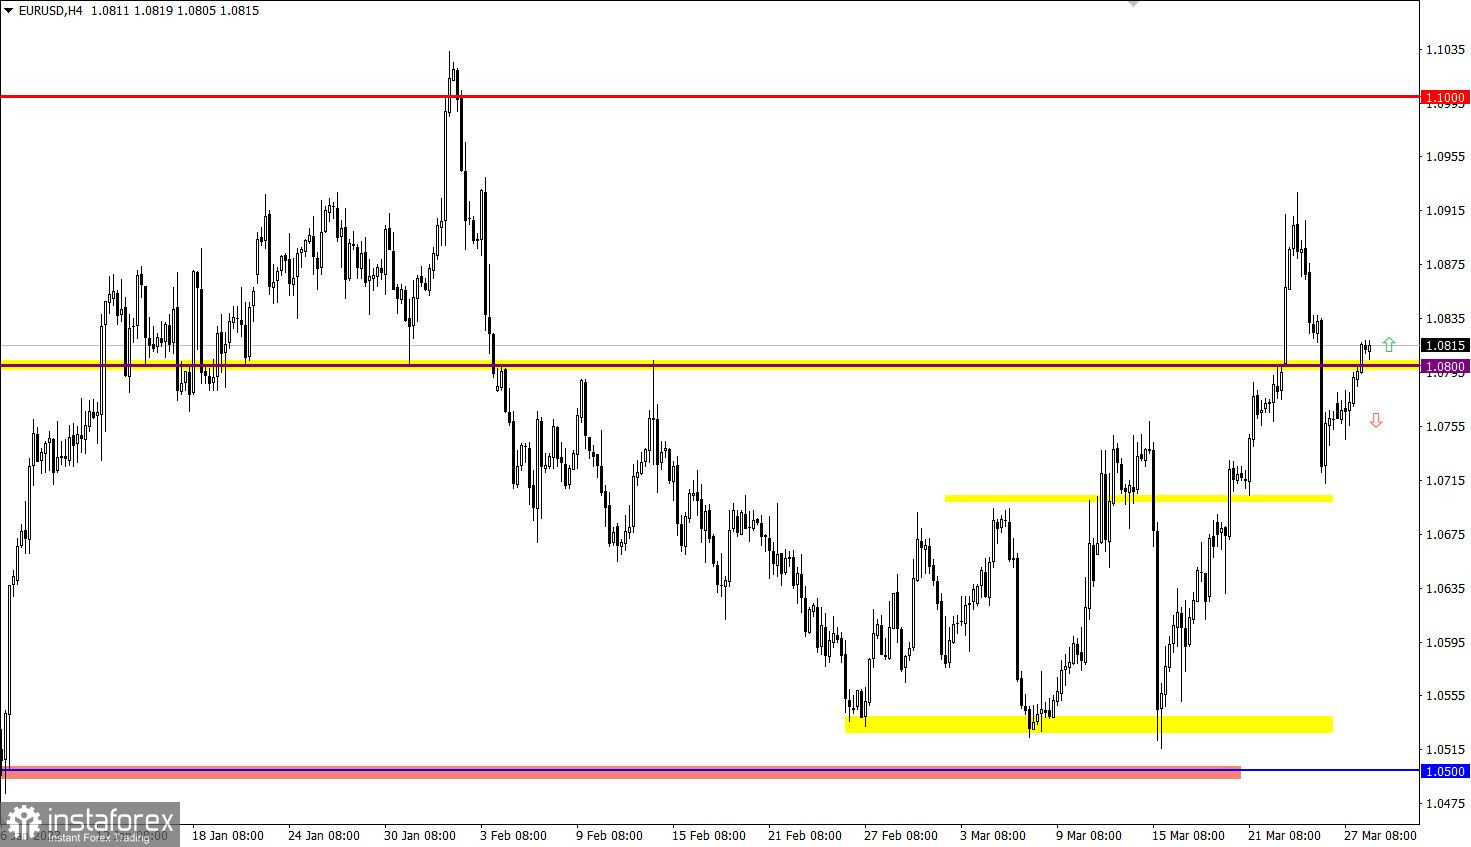
EUR/USD began to rise at the start of the new trading week, which allowed the exchange rate to rise above 1.0800. After falling last March 23–24, the value of the euro recovered by half. This move indicates a continued upward trend among market participants.
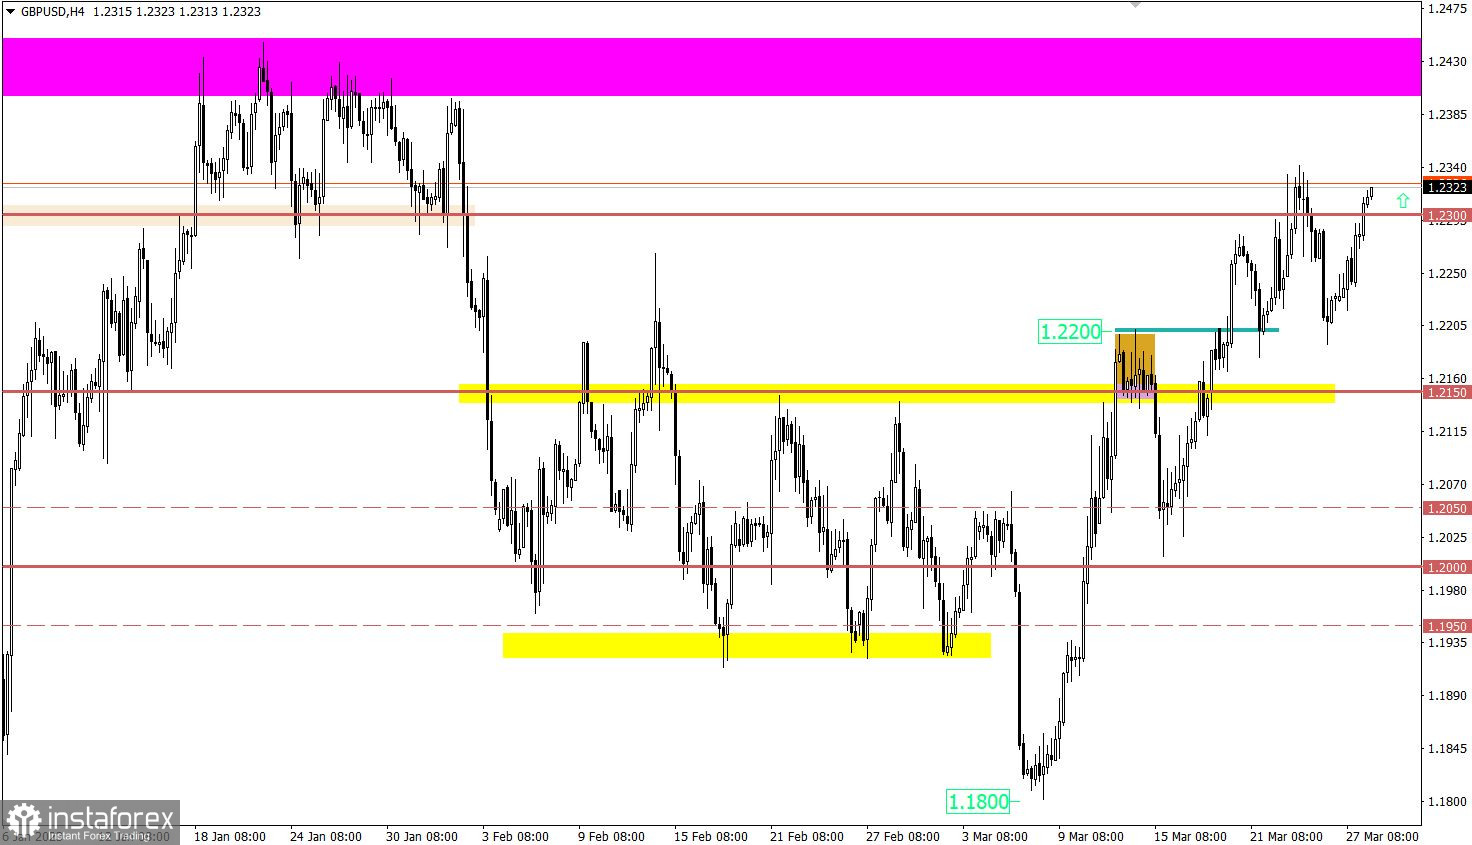
GBP/USD also regained its value from its recent fall. The quote rose above 1.2300, which indicates an increase in the volume of long positions on the pound.

The S&P CoreLogic Case-Shiller Home Price Index in the United States is expected to be released today and is estimated to decline. If the data does turn out to be this way, it will not be a favorable signal for the U.S. dollar.
Time targeting:
S&P CoreLogic Case-Shiller Home Price Index – 13:00 UTC
If the price holds steadily above the 1.0800 level, it may lead to further growth in long positions, in which case the euro exchange rate may continue to rise to its recent local high. However, if the quote falls below the level of 1.0800 and stays there within the day, this may lead to a new wave of decline.
A stable holding of the price above the level of 1.2300 will eventually lead to the continuation of the upward trend. However, long positions may face an obstacle in the form of a medium-term upward trend high zone in the 1.2400/1.2450 range, which will put pressure on buyers.
The candlestick chart type is white and black graphic rectangles with lines above and below. With a detailed analysis of each individual candle, you can see its characteristics relative to a particular time frame: opening price, closing price, intraday high and low.
Horizontal levels are price coordinates, relative to which a price may stop or reverse its trajectory. In the market, these levels are called support and resistance.
Circles and rectangles are highlighted examples where the price reversed in history. This color highlighting indicates horizontal lines that may put pressure on the asset's price in the future.
The up/down arrows are landmarks of the possible price direction in the future.
*这里的市场分析是为了增加您对市场的了解,而不是给出交易的指示。
InstaSpot分析评论将让您充分了解市场趋势! 作为InstaSpot的客户,您将获得大量的免费服务以实现有效的交易。


