


我们的团队有超过700万的操盘手!
我们每天都在一起努力改善交易。我们得到了很高的成绩,并继续前进。
世界各地数以百万计的操盘手的认可是我们工作的最大赞赏! 您做出了您的选择,我们将尽一切努力来满足您的期望!
我们是一个共同的伟大团队!
InstaSpot. 自豪地为您工作!


The price of gold is trading in the green at 1,913 on the H1 chart. XAU/USD registered sharp movements in both directions around the US inflation data. Technically, the price action signaled exhausted sellers. Still, a strong rebound needs strong confirmation.
Fundamentally, you knew from my previous analysis that the US economic data could be decisive. The CPI rose by 0.6% matching expectations, CPI y/y reported a 3.7% growth, beating the 3.6% growth estimates, while Core CPI increased by 0.3%, exceeding the 0.2% growth forecasts. In addition, the UK GDP reported a 0.5% drop versus the 0.2% drop expected.
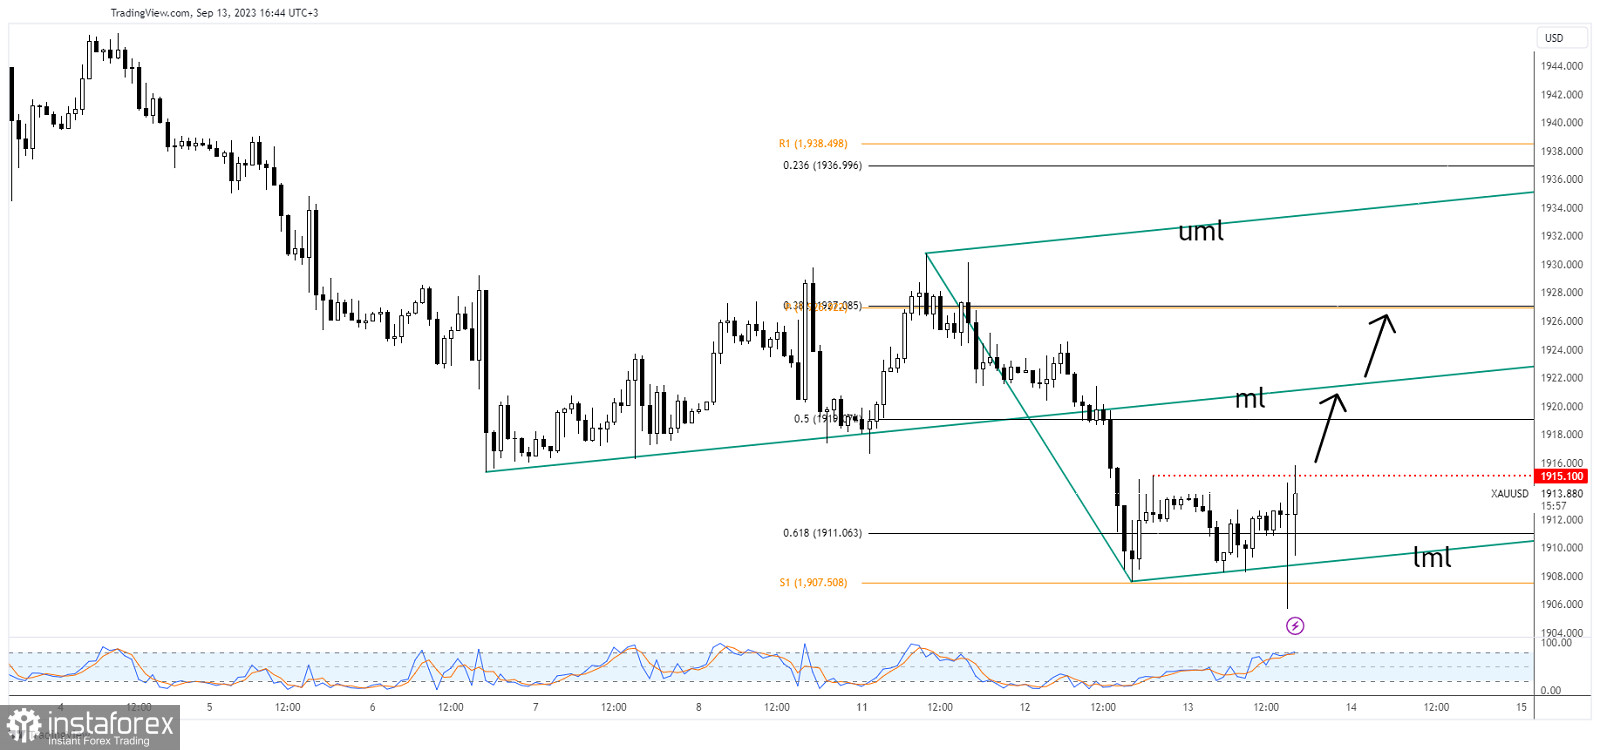
Technically, the price of gold registered a false breakout with great separation below the weekly S1 (1,907) and through the pitchfork's lower median line, indicating that the sell-off could be over.
The former high of 1,915 represents a static resistance. In the short term, it could move sideways around 61.8% (1,911).
A new higher high, a bullish closure above today's high of 1,915 activates a larger rebound and is seen as a new buying opportunity.
*这里的市场分析是为了增加您对市场的了解,而不是给出交易的指示。
InstaSpot分析评论将让您充分了解市场趋势! 作为InstaSpot的客户,您将获得大量的免费服务以实现有效的交易。


