


The legend in the InstaSpot team!
Legend! You think that's bombastic rhetoric? But how should we call a man, who became the first Asian to win the junior world chess championship at 18 and who became the first Indian Grandmaster at 19? That was the start of a hard path to the World Champion title for Viswanathan Anand, the man who became a part of history of chess forever. Now one more legend in the InstaSpot team!


Borussia is one of the most titled football clubs in Germany, which has repeatedly proved to fans: the spirit of competition and leadership will certainly lead to success. Trade in the same way that sports professionals play the game: confidently and actively. Keep a "pass" from Borussia FC and be in the lead with InstaSpot!
At a monetary policy meeting yesterday, the Bank of England raised interest rates by 25 basis points to 4.25%, the highest rates since October 2008. Back then, interest rates were at 4.50%. The increase came due to persistent inflation. In February and January, consumer prices accelerated to 10.4% and 10.1% respectively. Meanwhile, economists had expected inflation to slow down in February. However, the latest press release hints at a possible end of the tightening cycle in the near term. So, it may be that we will soon see the regulator pause tightening.
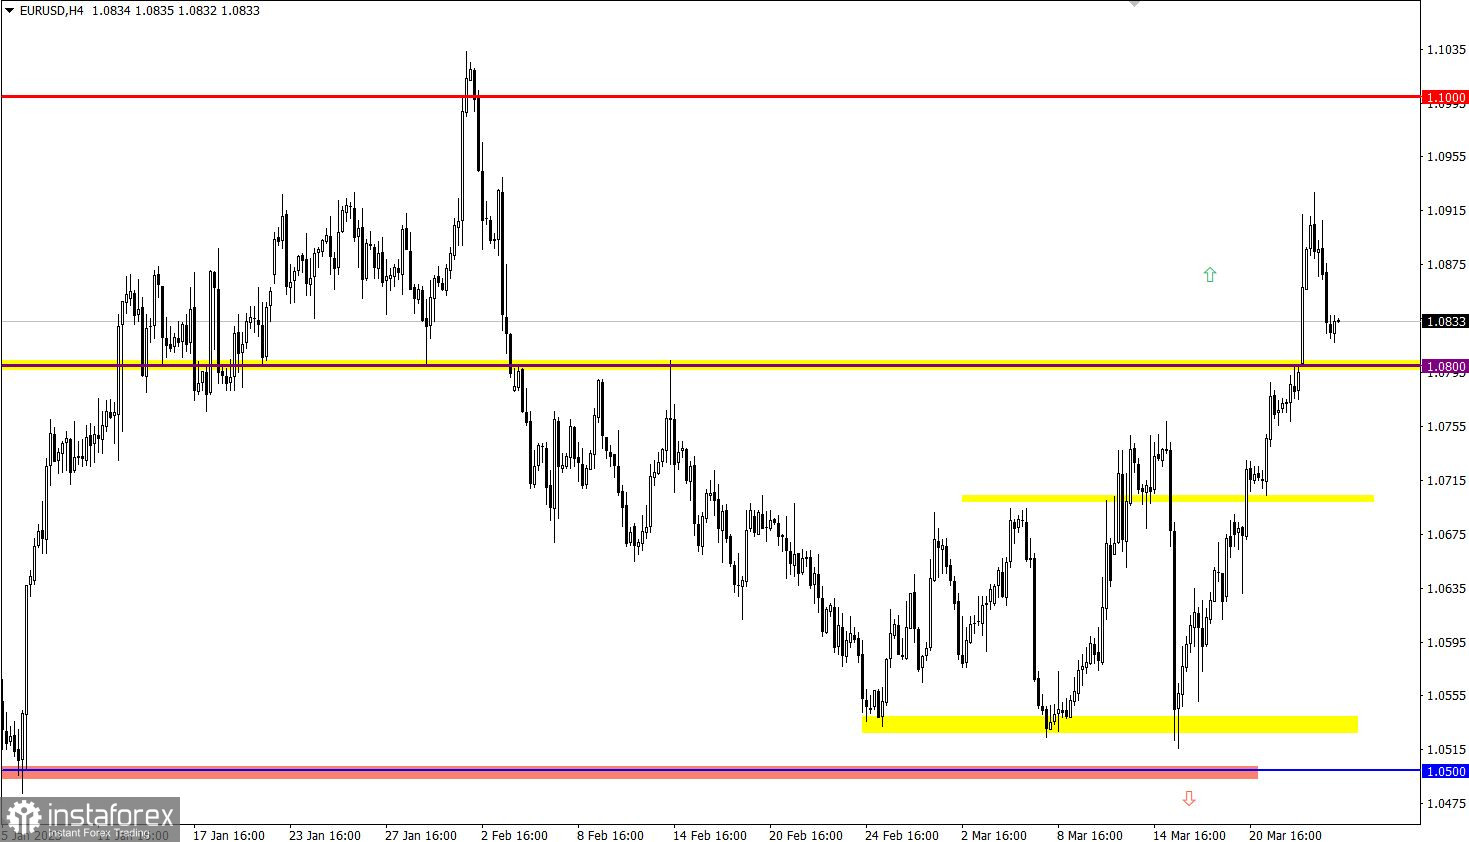
EUR/USD has gained over 250 pips since the beginning of the week. That triggered a horizontal movement with a signal to buy EUR. The volume of long positions decreased and the price retreated.
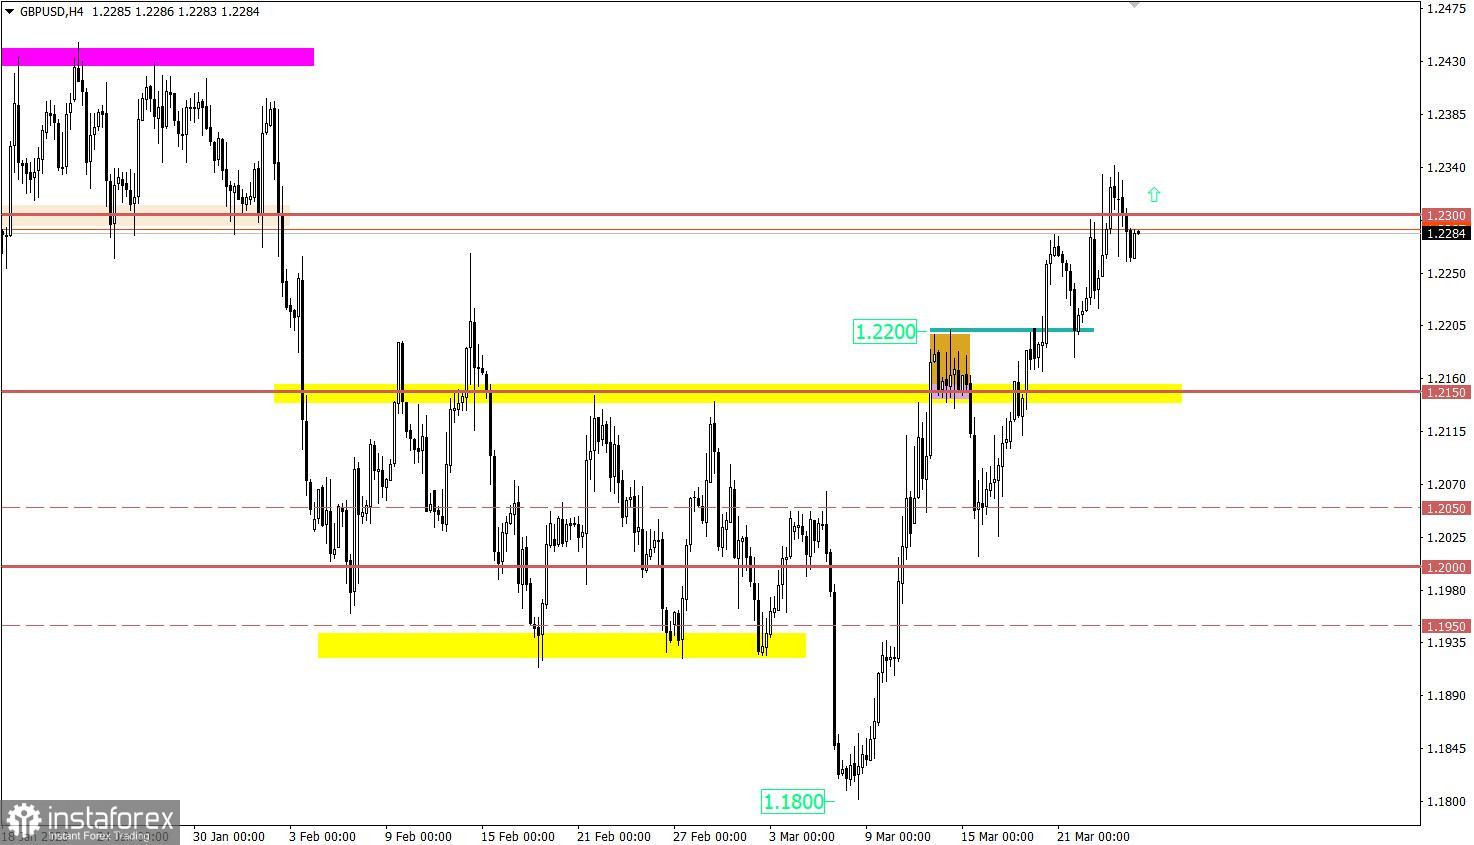
Once 1.2300 resistance was reached, GBP/USD pulled back somewhat. Nevertheless, the bull trend goes on. The pound has recouped almost all losses incurred in February.
With the opening of European trade, UK retail sales came in, showing a rise to -3.5% versus -5.4% year-on-year. On a monthly basis, figures grew by 1.2%.
Today, a series of business activity reports will be delivered in the eurozone, the United States, and the United Kingdom. Economists expect figures to decline across the board.
EUR/USD retreated to 1.0800 support. The price may rebound from this mark with a rise in buying volumes.
Alternatively, EUR/USD may go down if quotes stay below 1.0800 intraday.
A pullback may cause a shift in sentiment. Should the price go above 1.2300, it would generate a signal to buy GBP. This could lead to a bullish continuation, and the pair could update the swing high of the medium-term trend.
Alternatively, if quotes fall below 1.2200, it will mark the rise of a downtrend.
The candlestick chart shows graphical white and black rectangles with upward and downward lines. While conducting a detailed analysis of each individual candlestick, it is possible to notice its features intrinsic to a particular time frame: the opening price, the closing price, and the highest and lowest price.
Horizontal levels are price levels, in relation to which a stop or reversal of the price may occur. They are called support and resistance levels.
Circles and rectangles are highlighted examples where the price reversed in the course of its history. This color highlighting indicates horizontal lines which can exert pressure on prices in the future.
Upward/downward arrows signal a possible future price direction.
*这里的市场分析是为了增加您对市场的了解,而不是给出交易的指示。
InstaSpot分析评论将让您充分了解市场趋势! 作为InstaSpot的客户,您将获得大量的免费服务以实现有效的交易。


