


我们的团队有超过700万的操盘手!
我们每天都在一起努力改善交易。我们得到了很高的成绩,并继续前进。
世界各地数以百万计的操盘手的认可是我们工作的最大赞赏! 您做出了您的选择,我们将尽一切努力来满足您的期望!
我们是一个共同的伟大团队!
InstaSpot. 自豪地为您工作!


The U.S. Federal Reserve raised its benchmark interest rate for the eighth time in a year. During the March meeting, the regulator expectedly raised the interest rate by 25 basis points to 4.75–5%. The central bank also stressed some additional policy firming ahead.
As for the banking sector, Fed Chairman Jerome Powell has repeatedly said that the U.S. banking system is reliable and stable. According to him, recent events are likely to tighten credit conditions for households and businesses and put pressure on economic activity, hiring, and inflation.
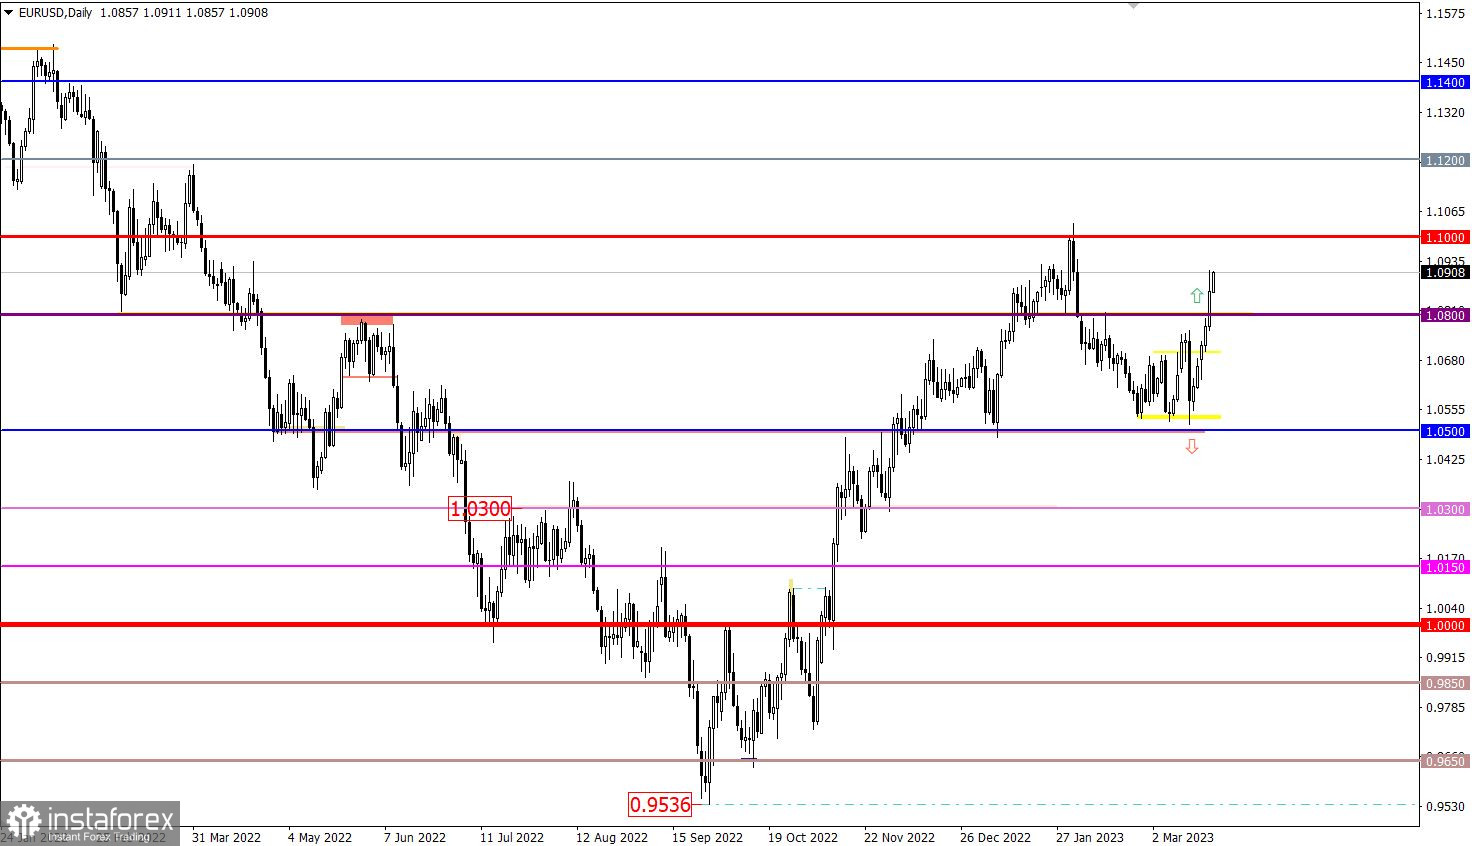
EUR/USD broke through the 1.0800 resistance level during the inertial movement. As a result, there was an increase in the volume of long positions, which indicated the recovery of the euro relative to the decline in February.
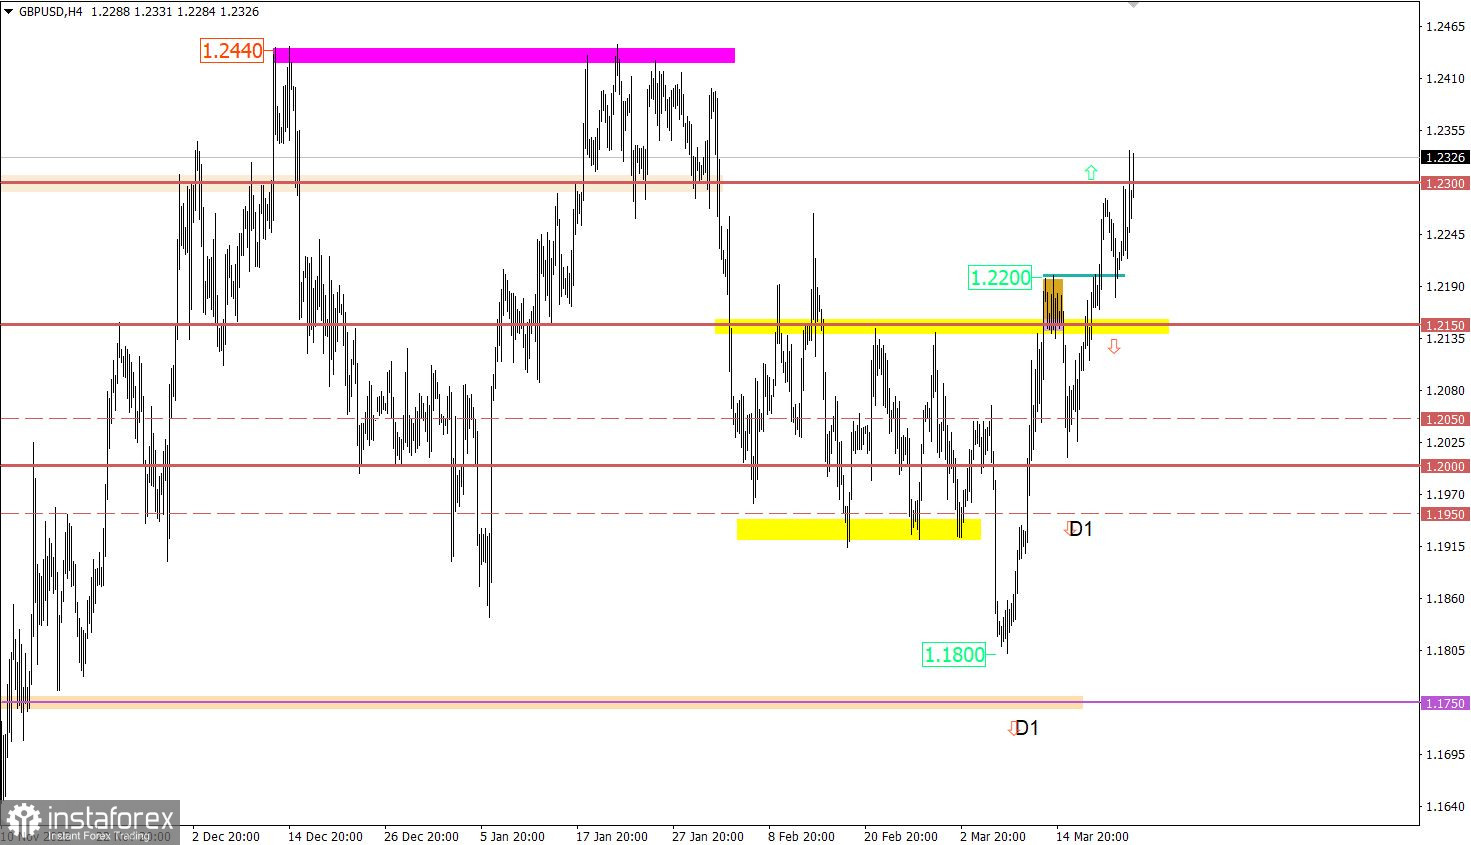
GBP/USD jumped above 1.2300 during the general sale of dollar positions. This move indicates a subsequent price recovery from the fall in February.

The Bank of England will hold a meeting today, where interest rate is expected to be raised by 25 basis points to 4.25%. Of particular interest will be the regulator's commentary on future actions. Note that inflation data released yesterday showed an acceleration in growth to 10.4%. This may serve as a basis for a further interest rate hike.
Time targeting:
Bank of England meeting results – 12:00 UTC
Based on the technical signal that the euro is overbought in the intraday period, we can assume that a pullback will appear on the market. During which, there will be a regrouping of long positions. However, speculators may ignore signals from technical analysis in vain. In this case, the price may move towards the local high of the medium-term upward trend (1.1033).
A stable holding of the price above the level of 1.2300 allows the further growth of the British currency up to complete recovery. However, it is worth taking into account the technical factor of overbought, which can reach a critical point in this price move.
What's on the charts
The candlestick chart type is white and black graphic rectangles with lines above and below. With a detailed analysis of each individual candle, you can see its characteristics relative to a particular time frame: opening price, closing price, intraday high and low.
Horizontal levels are price coordinates, relative to which a price may stop or reverse its trajectory. In the market, these levels are called support and resistance.
Circles and rectangles are highlighted examples where the price reversed in history. This color highlighting indicates horizontal lines that may put pressure on the asset's price in the future.
The up/down arrows are landmarks of the possible price direction in the future.
*这里的市场分析是为了增加您对市场的了解,而不是给出交易的指示。
InstaSpot分析评论将让您充分了解市场趋势! 作为InstaSpot的客户,您将获得大量的免费服务以实现有效的交易。


