


The legend in the InstaSpot team!
Legend! You think that's bombastic rhetoric? But how should we call a man, who became the first Asian to win the junior world chess championship at 18 and who became the first Indian Grandmaster at 19? That was the start of a hard path to the World Champion title for Viswanathan Anand, the man who became a part of history of chess forever. Now one more legend in the InstaSpot team!


Borussia is one of the most titled football clubs in Germany, which has repeatedly proved to fans: the spirit of competition and leadership will certainly lead to success. Trade in the same way that sports professionals play the game: confidently and actively. Keep a "pass" from Borussia FC and be in the lead with InstaSpot!
The European Central Bank (ECB) expectedly raised the key interest rate by 50 basis points to 3.5% but also pointed to reduce its balance sheet by 15 billion euros per month. Everything is within market expectations.
The regulator stressed that its future rate decisions would depend on incoming data.
Regarding the turbulence in the banking sector, the ECB said that everything is stable and, if anything, the regulator has all the tools to support and provide liquidity.
The euro's reaction to the ECB's decisions was a subsequent recovery in value.
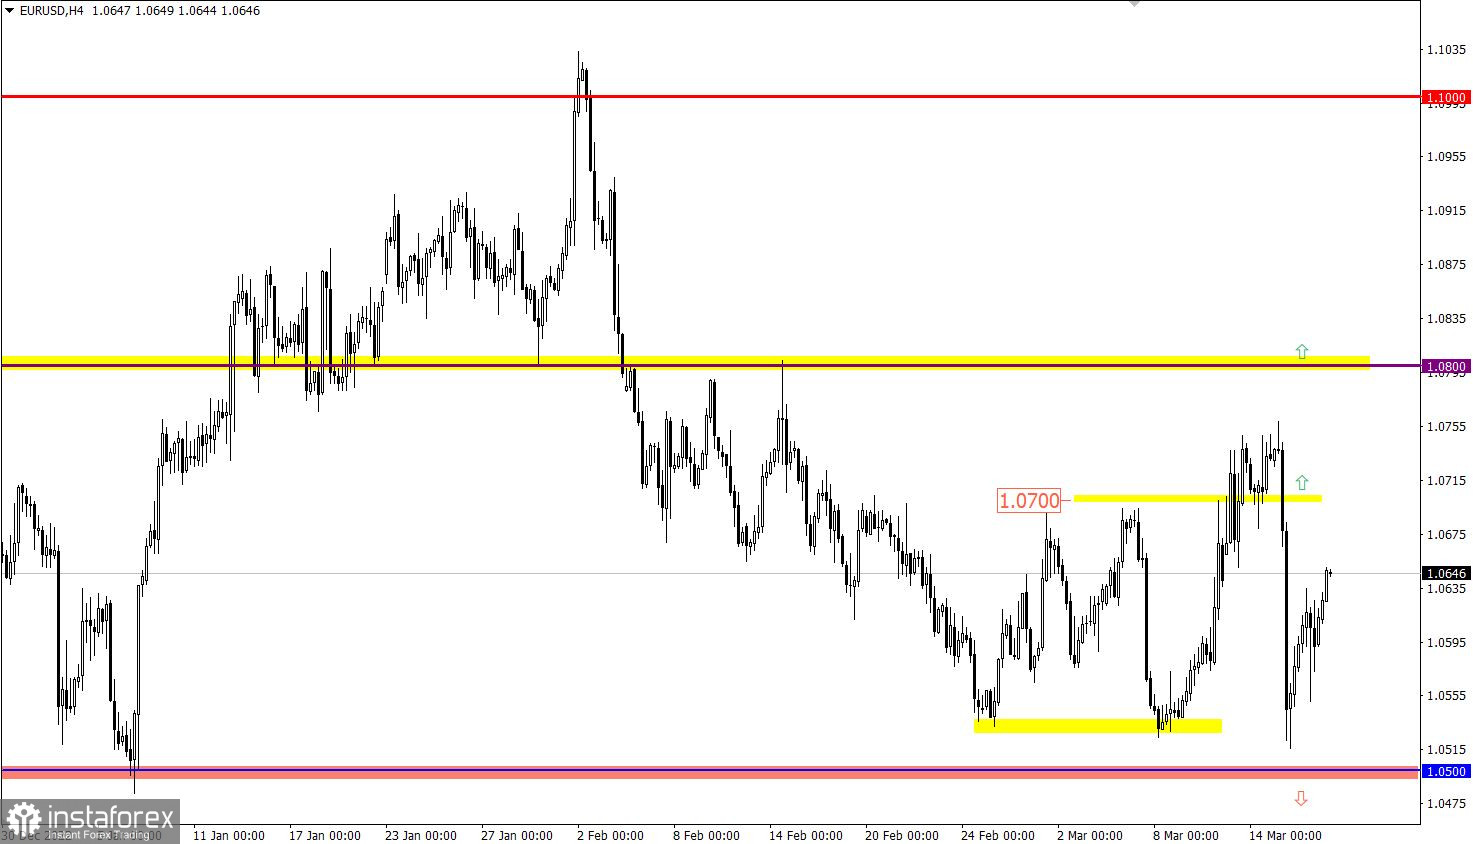
EUR/USD recovered by more than 50% after the recent fall. The 1.0500 support level, from which the step-by-step growth in the volume of long positions started, acts as a support.
GBP/USD has fully offset the recent decline. The quote returned above the level of 1.2150, which indicates the prevailing upward mood among market participants.

Today, the focus is on the final data on inflation in the Eropean Union. Economists estimate that data should come out in line with preliminary estimate of 8.5%. The data is already priced in, but if it turns out different than forecasts, this may cause speculative price fluctuations.
Time targeting:
EU Inflation Data – 10:00 UTC
In the current situation, the euro may continue to rise towards 1.0700. As for more significant price changes, for them to occur, it is necessary to update the local high of the current week.
Presumably, a stable holding of the price above the level of 1.2150 will lead to a subsequent increase in the volume of long positions. In turn, this may contribute to further growth of the pound sterling towards the level of 1.2300.

The candlestick chart type is white and black graphic rectangles with lines above and below. With a detailed analysis of each individual candle, you can see its characteristics relative to a particular time frame: opening price, closing price, intraday high and low.
Horizontal levels are price coordinates, relative to which a price may stop or reverse its trajectory. In the market, these levels are called support and resistance.
Circles and rectangles are highlighted examples where the price reversed in history. This color highlighting indicates horizontal lines that may put pressure on the asset's price in the future.
The up/down arrows are landmarks of the possible price direction in the future.
*这里的市场分析是为了增加您对市场的了解,而不是给出交易的指示。
InstaSpot分析评论将让您充分了解市场趋势! 作为InstaSpot的客户,您将获得大量的免费服务以实现有效的交易。


