


我们的团队有超过700万的操盘手!
我们每天都在一起努力改善交易。我们得到了很高的成绩,并继续前进。
世界各地数以百万计的操盘手的认可是我们工作的最大赞赏! 您做出了您的选择,我们将尽一切努力来满足您的期望!
我们是一个共同的伟大团队!
InstaSpot. 自豪地为您工作!


EUR/USD
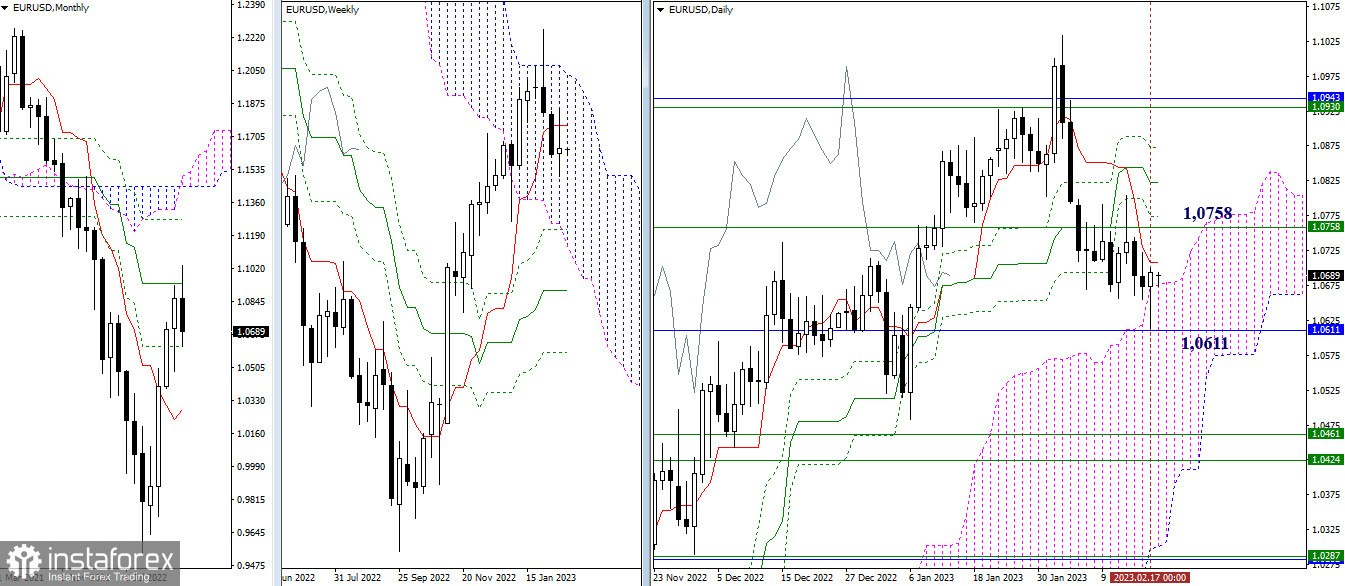
Higher time frames
On Friday, the pair tested the monthly support level at 1.0611 and rebounded from there on the daily chart. Still, the euro closed the week with a candlestick which does not clear up the situation. Today the pair is holding between the daily short-term trend at 1.0709 and the upper limit of the daily Ichimoku Cloud at 1.0675. In case bulls manage to develop an uptrend, the price may return to the weekly short-term trend at 1.0758. If bears prevail this time, the pair may again test the monthly support at 1.0611.

H4 – H1
On lower time frames, the pair is trading between the central daily pivot level of 1.0669 and the weekly long-term trend of 1.0698. This range is confirmed on the daily time frame. So, consolidation above or below its boundaries will have a significant effect on the pair. The next upward targets on the intraday chart are found at support formed by the standard pivot levels of 1.0724 – 1.0755 – 1.0810. As for downward targets, they are located at the support of the standard pivot levels of 1.0638 – 1.0583 – 1.0552.
***
GBP/USD

Higher time frames
The pair closed last week with a candlestick predicting uncertainty. The instrument is still trading inside the daily Ichimoku Cloud. Current daily targets remained the same. The main target for bears is the area of 1.1842 – 1.1795 (monthly level + lower boundary of the daily Ichimoku Cloud). The main upward targets for bulls are the daily levels of 1.2118 – 1.2092 supported by the weekly short-term trend at 1.2144.

H4 – H1
On lower time frames, the pound has settled above the central pivot level of 1.1999 and is set to head for the weekly long-term trend at 1.2064. Consolidation above this level and a reversal of the moving average can change the market balance on lower time frames. Additional intraday targets are found at the support of the standard pivot levels of 1.1952 – 1.1866 – 1.1819 and the resistance area of 1.2085 – 1.2132 – 1.2218).
***
Technical analysis is based on:
Higher time frames – Ichimoku Kinko Hyo (9.26.52) + Fibo Kijun levels
Lower time frames – H1: Pivot Points (standard) + 120-day Moving Average (weekly long-term trend)
*这里的市场分析是为了增加您对市场的了解,而不是给出交易的指示。
InstaSpot分析评论将让您充分了解市场趋势! 作为InstaSpot的客户,您将获得大量的免费服务以实现有效的交易。


