


The legend in the InstaSpot team!
Legend! You think that's bombastic rhetoric? But how should we call a man, who became the first Asian to win the junior world chess championship at 18 and who became the first Indian Grandmaster at 19? That was the start of a hard path to the World Champion title for Viswanathan Anand, the man who became a part of history of chess forever. Now one more legend in the InstaSpot team!


Borussia is one of the most titled football clubs in Germany, which has repeatedly proved to fans: the spirit of competition and leadership will certainly lead to success. Trade in the same way that sports professionals play the game: confidently and actively. Keep a "pass" from Borussia FC and be in the lead with InstaSpot!
EUR/USD
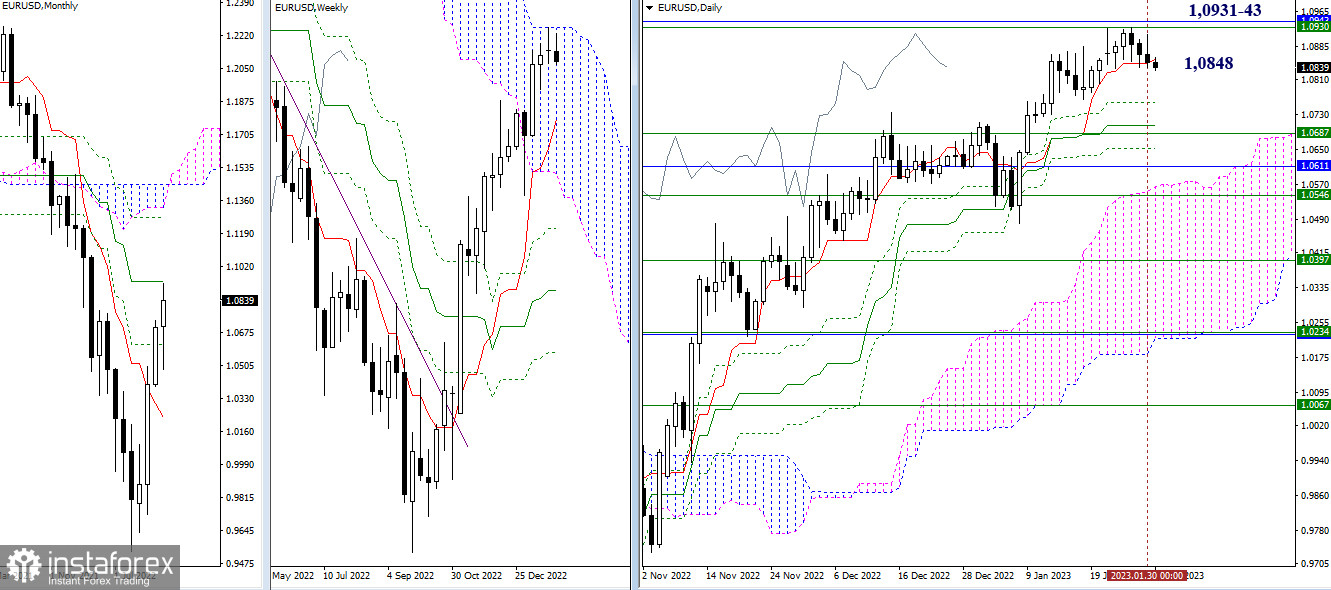
Higher time frames
The situation has not changed much over the past 24 hours. The pair is still holding near the support level of the daily short-term trend (1.0848). Consolidation below this level and a further decline will bring the price to the lower levels of the daily Ichimoku Cross at 1.0759 – 1.0706 – 1.0653 and the weekly short-term trend at 1.0687. The bearish scenario is more likely in current conditions for various reasons. If bulls return to the market at some point, their main target will be the key resistance of 1.0931-43 (upper boundary of the weekly Ichimoku Cloud + monthly medium-term trend).
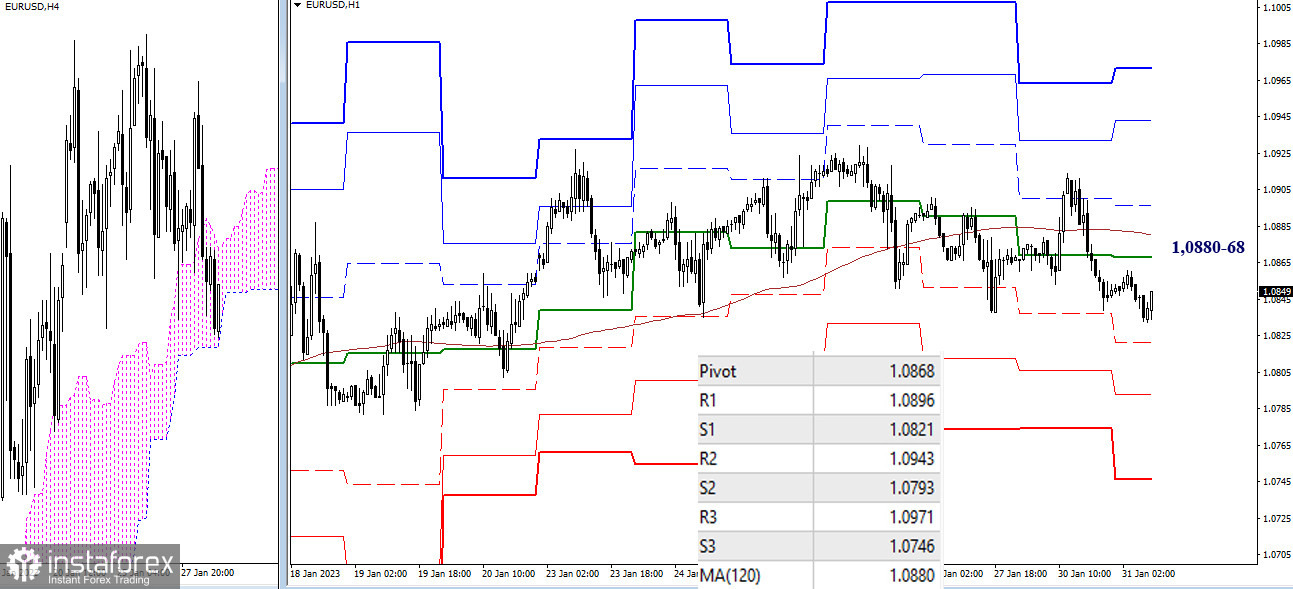
H4 – H1
Bears are taking over the pair on lower time frames. The pair is currently trading below the central pivot level of 1.0868 and the weekly long-term trend of 1.0880. The next downward targets on the intraday chart are found at the support of standard pivot levels of 1.0821 – 1.0793 – 1.0746. A breakout of the Ichimoku Cloud on H4 and consolidation in the selling zone will support the bearish trend and will send the price for a new breakout.
***
GBP/USD
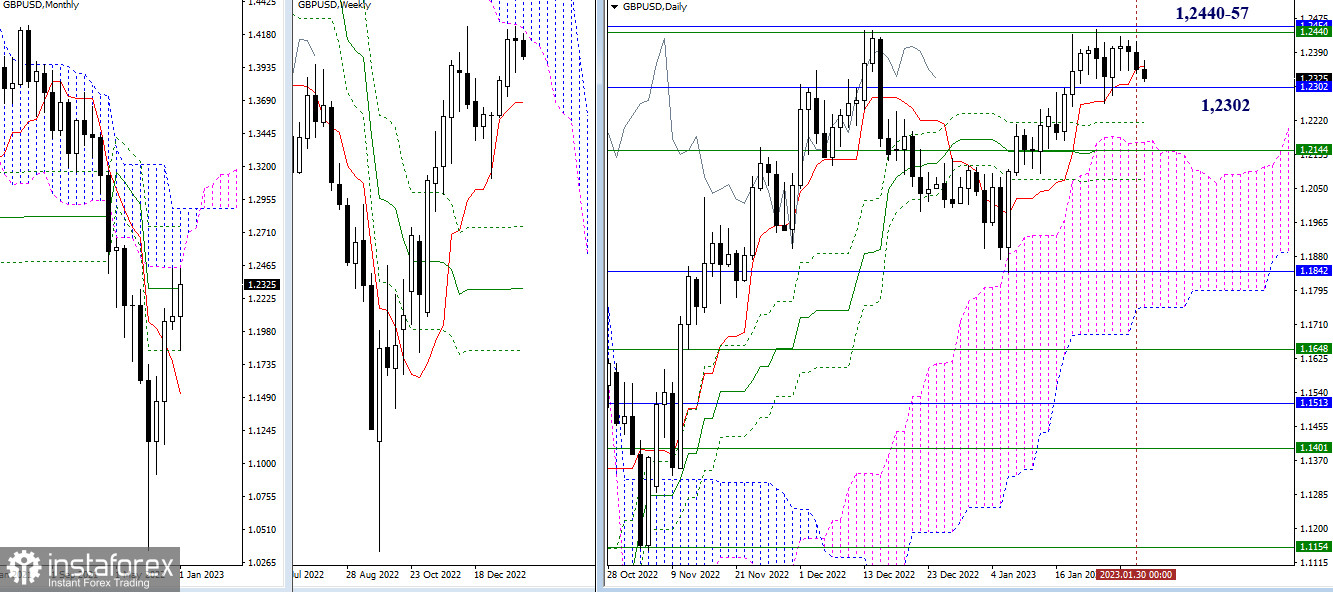
Higher time frames
The daily short-term trend has slightly shifted from the level of 1.2302. The pair is still trading in the range between 1.2457-40 (upper boundaries of Ichimoku Clouds on monthly and weekly time frames) and 1.2302 (monthly medium-term trend). If the price leaves these boundaries, it may develop a new trajectory.
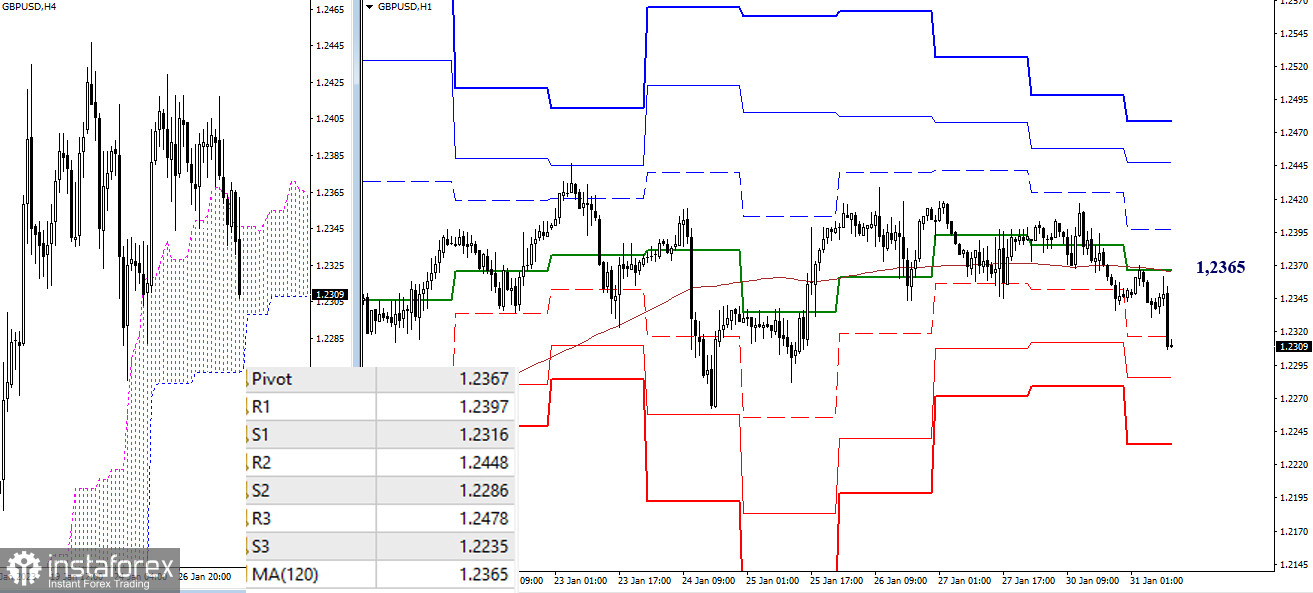
H4 – H1
On lower time frames, the price has slipped below the key levels found at 1.2367-65 (central pivot level + weekly long-term trend). Trading below this range will support the sellers. Other intraday targets for bears are located at standard pivot levels of 1.2286 and 1.2235 as well as at the lower boundary of the cloud on H4. If the price settles outside the H4 cloud, it may head lower for new downward targets.
***
Technical analysis is based on:
Higher time frames – Ichimoku Kinko Hyo (9.26.52) + Fibo Kijun levels
Lower time frames – H1: Pivot Points (standard) + 120-day Moving Average (weekly long-term trend)
*这里的市场分析是为了增加您对市场的了解,而不是给出交易的指示。
InstaSpot分析评论将让您充分了解市场趋势! 作为InstaSpot的客户,您将获得大量的免费服务以实现有效的交易。


