


我们的团队有超过700万的操盘手!
我们每天都在一起努力改善交易。我们得到了很高的成绩,并继续前进。
世界各地数以百万计的操盘手的认可是我们工作的最大赞赏! 您做出了您的选择,我们将尽一切努力来满足您的期望!
我们是一个共同的伟大团队!
InstaSpot. 自豪地为您工作!


UK retail sales came out worse than expected. The decline rate was estimated to slow from -5.7% to -4.1%, but actual data came out at -5.8%, which had a negative impact on the value of the British pound.
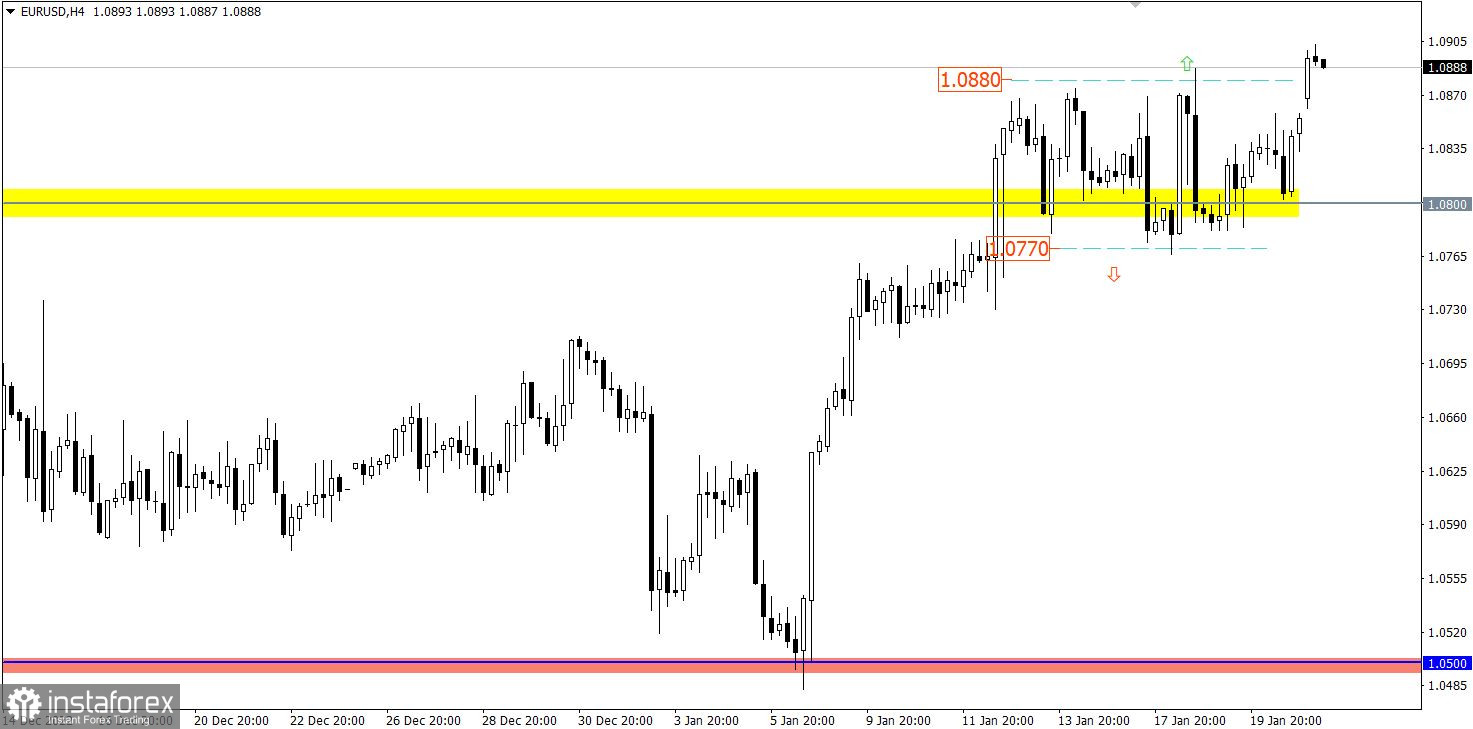
The EURUSD currency pair spent the entire past week within the side channel 1.0770/1.0880, but during the new trading week its upper limit was broken. This indicates the prevailing upward mood among traders, where the medium-term trend from last fall is still relevant in the market.
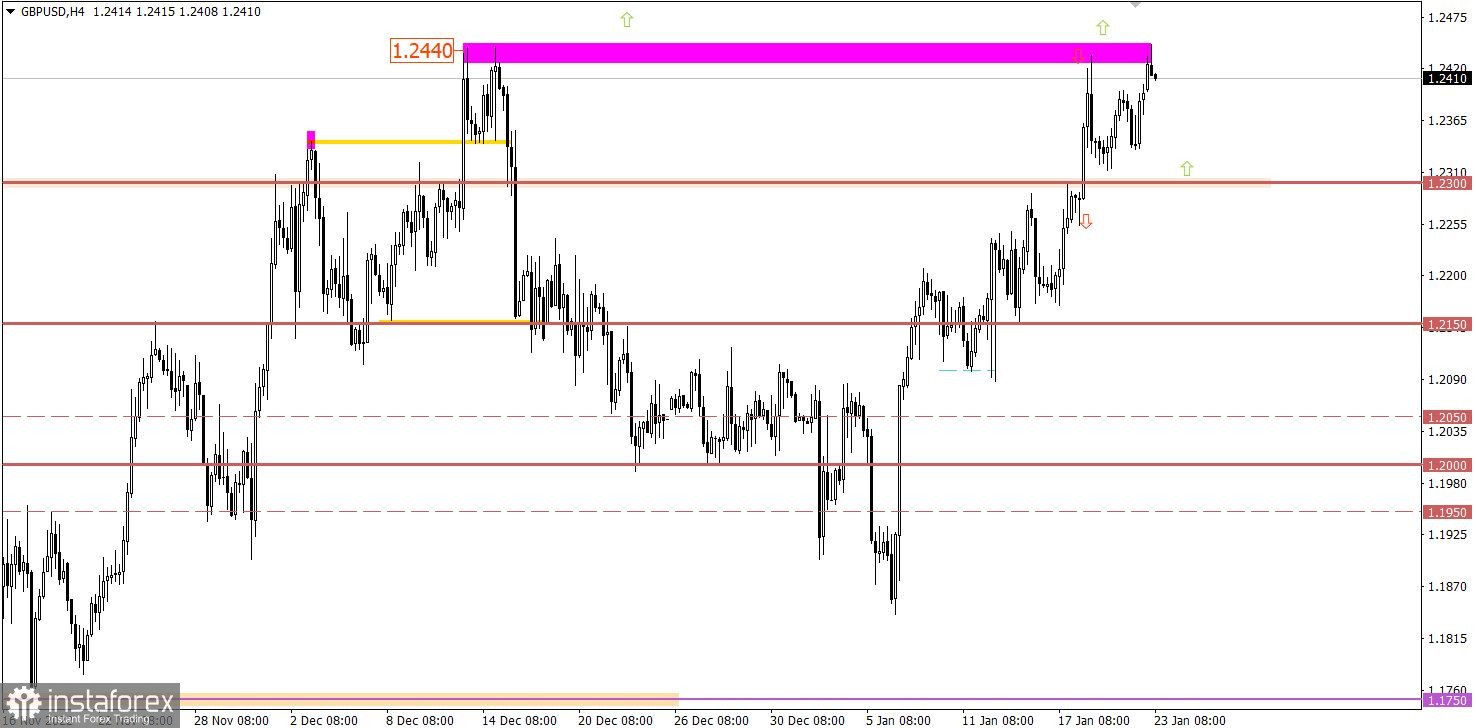
The GBPUSD currency pair reached the local December high during the past week, relative to which there was a reduction in the volume of long positions. This led to a pullback towards the previously passed level 1.2300, while the upward trend remains in the market. This is indicated by the lack of price retention below 1.2300.

The economic calendar is traditionally empty on Monday. No important reports are expected in the EU, the United Kingdom, and the Unites States.
A stable holding of the price above the value of 1.0900 will eventually lead to strengthening of long positions in the direction of the 1.1000 psychological level. This step, in turn, will consolidate the bullish mood for the euro, which once again indicates a change in medium-term interests in the market.
Traders will consider the alternative scenario if the price returns below 1.0850. In this case, the amplitude move of 1.0770/1.0880 may resume.
Since the opening of a new trading week, a local high has been shot through, which once again indicates the prevailing upward mood among market participants. A stable holding of the price above the value of 1.2450 for at least a four-hour period will lead to a prolongation of the upward trend from the beginning of October last year.
Until then, the risk of variable turbulence remains at 1.2300/1.2450.
The candlestick chart type is white and black graphic rectangles with lines above and below. With a detailed analysis of each individual candle, you can see its characteristics relative to a particular time frame: opening price, closing price, intraday high and low.
Horizontal levels are price coordinates, relative to which a price may stop or reverse its trajectory. In the market, these levels are called support and resistance.
Circles and rectangles are highlighted examples where the price reversed in history. This color highlighting indicates horizontal lines that may put pressure on the asset's price in the future.
The up/down arrows are landmarks of the possible price direction in the future.
*这里的市场分析是为了增加您对市场的了解,而不是给出交易的指示。
InstaSpot分析评论将让您充分了解市场趋势! 作为InstaSpot的客户,您将获得大量的免费服务以实现有效的交易。


