


我们的团队有超过700万的操盘手!
我们每天都在一起努力改善交易。我们得到了很高的成绩,并继续前进。
世界各地数以百万计的操盘手的认可是我们工作的最大赞赏! 您做出了您的选择,我们将尽一切努力来满足您的期望!
我们是一个共同的伟大团队!
InstaSpot. 自豪地为您工作!


trend analysis:
EUR/USD will increase this December, starting from 1.0323 (closing of the November monthly candle) to 1.0609, which is the 38.2% retracement level (red dotted line). Then, it will go to the historical resistance level of 1.0784 (blue dotted line), before turning down again.
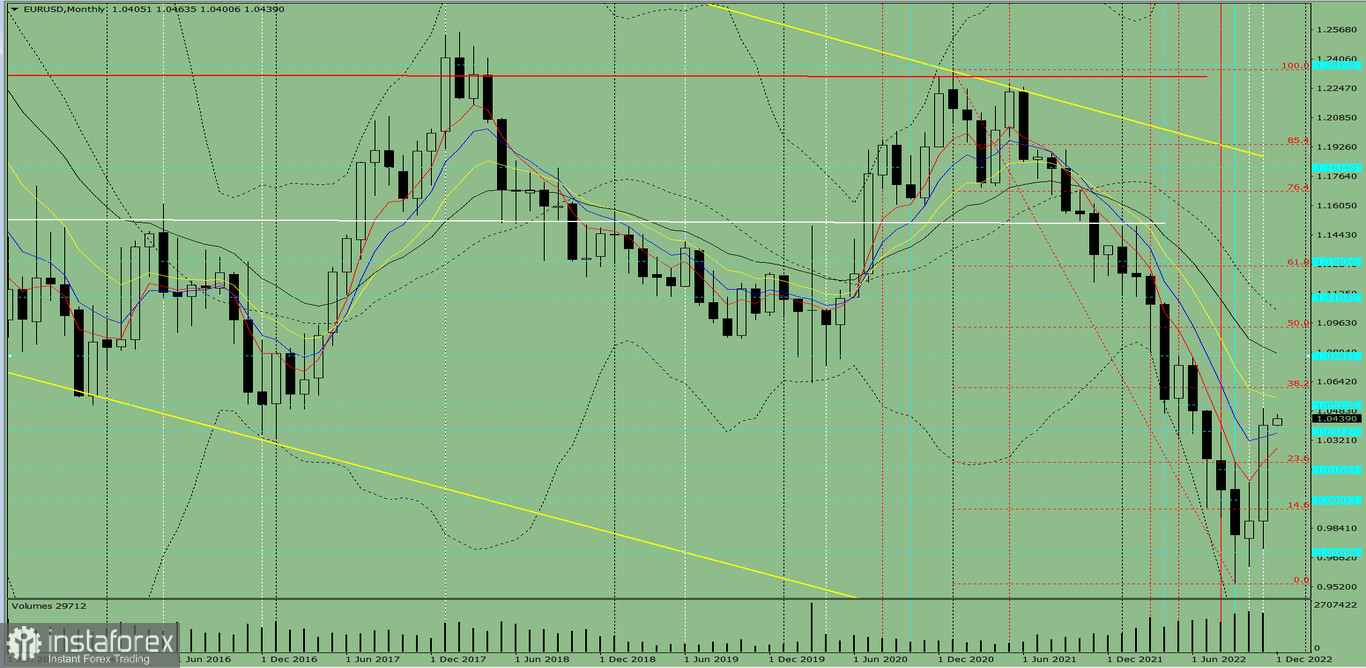
Fig. 1 (monthly chart)
Comprehensive analysis:
Indicator analysis - uptrend
Fibonacci levels - uptrend
Volumes - uptrend
Candlestick analysis - uptrend
Trend analysis - uptrend
Bollinger bands - uptrend
All this points to an upward movement in EUR/USD.
Conclusion: The pair will have a bullish trend, with no first lower shadow on the monthly white candle (the first week of the month is white) and no second upper shadow (the last week is white).
Throughout the month, quotes will climb from 1.0323 (closing of the November monthly candle) to the 38.2% retracement level at 1.0609 (red dotted line), go to the historical resistance level of 1.0784 (blue dotted line), then turn down again.
Alternatively, the pair could rise from 1.0323 (closing of the November monthly candle) to the 38.2% retracement level at 1.0609 (red dotted line), continue to the historical resistance level of 1.0784 (blue dotted line), then jump to the 50.0% retracement level at 1.0941 (blue dotted line). The downward movement may resume after testing this level.
*这里的市场分析是为了增加您对市场的了解,而不是给出交易的指示。
InstaSpot分析评论将让您充分了解市场趋势! 作为InstaSpot的客户,您将获得大量的免费服务以实现有效的交易。


