


我们的团队有超过700万的操盘手!
我们每天都在一起努力改善交易。我们得到了很高的成绩,并继续前进。
世界各地数以百万计的操盘手的认可是我们工作的最大赞赏! 您做出了您的选择,我们将尽一切努力来满足您的期望!
我们是一个共同的伟大团队!
InstaSpot. 自豪地为您工作!


After oil peaked at 130.44 in March, an upper limit was formed, and now the quote is approaching the nested line at 70.76.
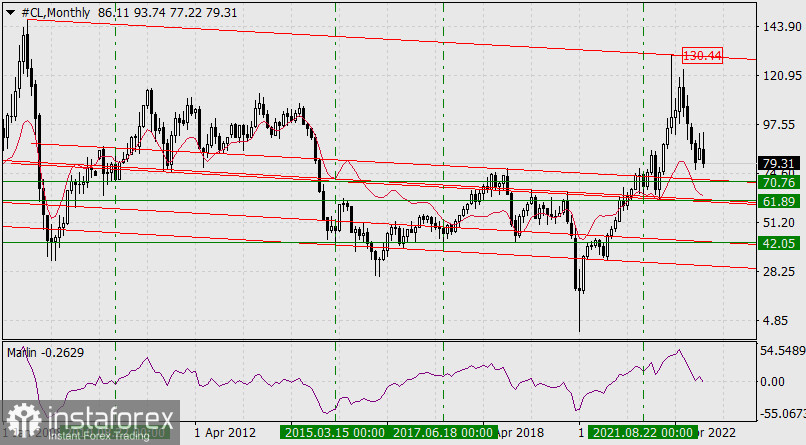
This level is the same as the August 2010 low. But even though the Marlin oscillator has already moved downwards (current value on the chart is -0.2629), it still has a long way to go.
In the medium term, the price may go beyond the support level of 70.76, which will open the way to the next nested price channel line of 61.89. Once this happens, there could be a further decline to 42.05, which is also the June 2017 low and the March 2015 low.
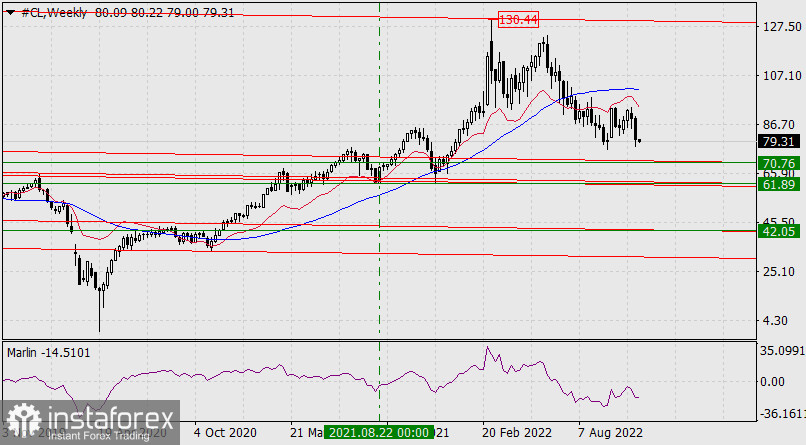
On the weekly chart, the price is declining under the balance and MACD lines, while the Marlin oscillator is going downwards.
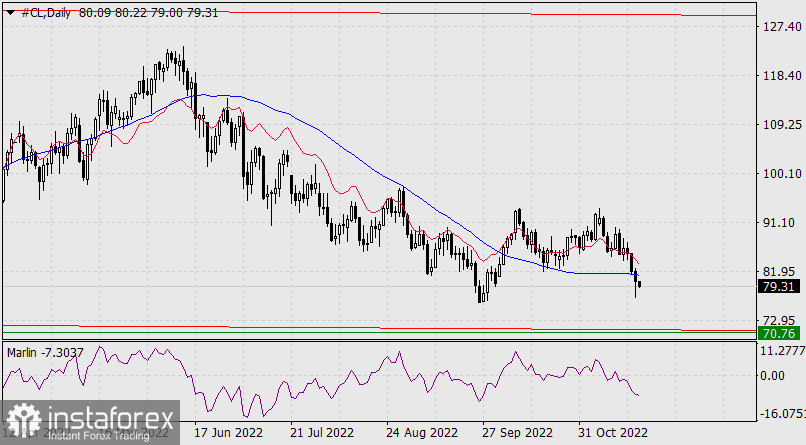
The same can be seen on the daily chart, as the price is under the MACD line, while the Marlin oscillator is declining towards a bearish area.
The strong downside potential of oil also affects the medium-term outlook of dollar and the stock market.
*这里的市场分析是为了增加您对市场的了解,而不是给出交易的指示。
InstaSpot分析评论将让您充分了解市场趋势! 作为InstaSpot的客户,您将获得大量的免费服务以实现有效的交易。


