


我们的团队有超过700万的操盘手!
我们每天都在一起努力改善交易。我们得到了很高的成绩,并继续前进。
世界各地数以百万计的操盘手的认可是我们工作的最大赞赏! 您做出了您的选择,我们将尽一切努力来满足您的期望!
我们是一个共同的伟大团队!
InstaSpot. 自豪地为您工作!


Data on the UK labor market came out worse than expected. The unemployment rate rose from 3.5% to 3.6%, while forecasts assumed previous level to remain. A negative factor in the report is also a reduction in employment by 52,000, with a forecast of 25,000.
Despite the negative factors, the pound sterling is maintaining its position in the market.
In Europe, the second estimate of GDP in the third quarter was published, which recorded growth of 2.1% in annual terms and 0.2% quarterly. These indicators fully coincided with the first estimate of GDP.
As for the US ballot count, the preliminary totals are:
House of Representatives: Democrats 209 - Republicans 217. Control requires 218 seats out of 435.
Senate: Democrats 50 - Republicans 49. Control requires 51 seats out of 100.
In some states, the second round of voting is underway, so there are no final data yet. Based on the available indicators, it becomes clear that the Senate is for the Democrats, and the House of Representatives is for the Republicans. In fact, everything will remain that way.
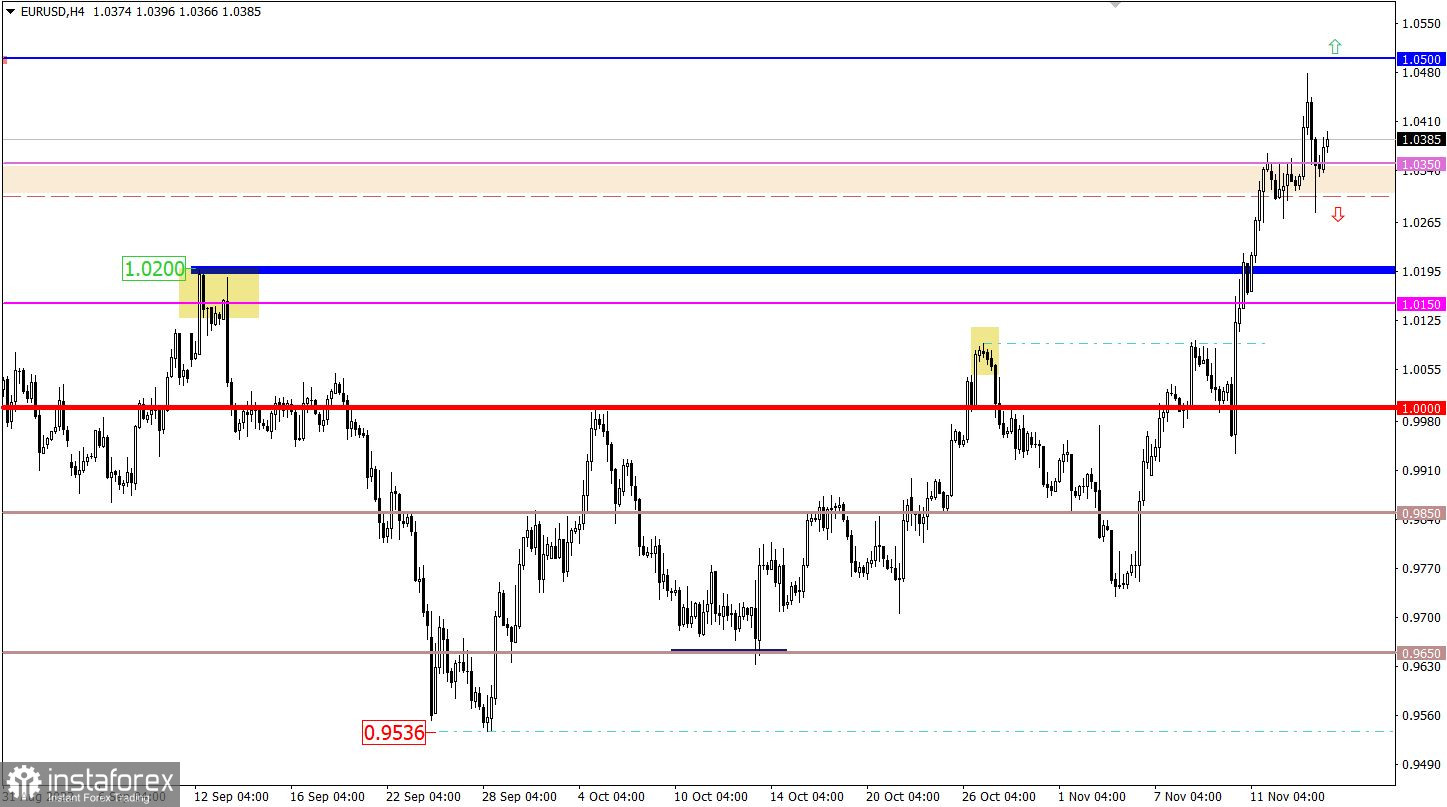
The EURUSD currency pair moved closer to the subsequent resistance level of 1.0500 during the rapid upward movement. As a result, there was a reduction in the volume of long positions, where the overheated euro moved into the stage of technical pullback.
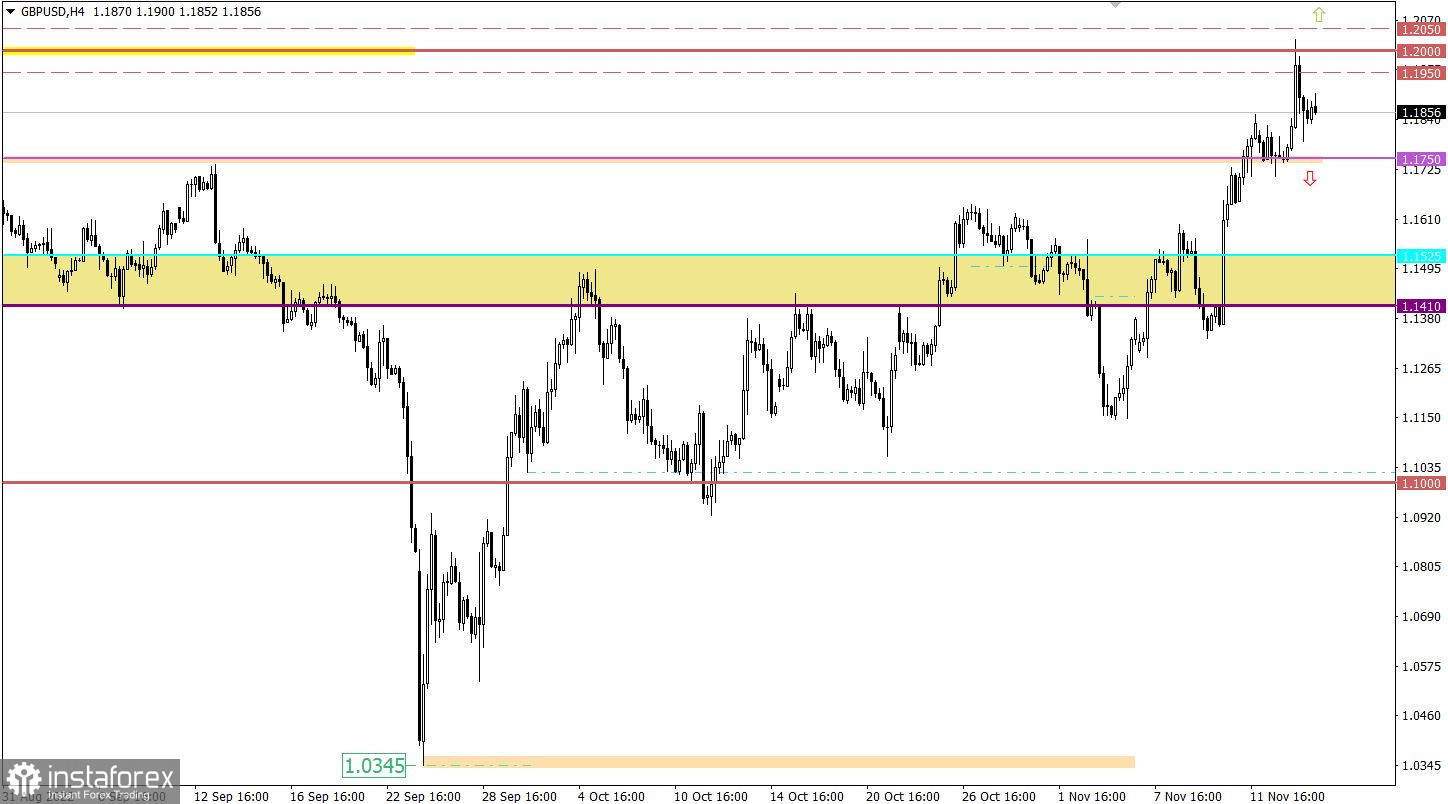
The GBPUSD currency pair strengthened its long positions after the quote moved to a stable hold above the 1.1750 level. As a result, there was a new cycle of growth of the pound sterling, where the quote reached the psychological level of 1.2000. The price change over the past day alone amounted to about 250 points, which eventually led to a technical pullback, where the 1.2000 level plays the role of resistance.
At the opening of the European session, data on UK inflation were published, whose growth rate accelerated from 10.1% to 11.1%. Consequently, the Bank of England will continue to raise interest rates at the same pace.
From a technical analysis point of view, the subsequent upward move will depend on whether buyers break through the 1.0500 resistance level. To confirm this signal, the quote must at least hold above this level in a four-hour period.
As for the transition from a pullback to a correction, this scenario will become relevant if the price stays below the level of 1.0300 in a four-hour period.
In this situation, the subsequent upward move is limited by the current level. Thus, in order for a new growth cycle to occur, the quote needs to stay above the value of 1.2050 in a four-hour or daily period. Until then, there is a risk of moving from a pullback to a full-size correction stage.
A candlestick chart view is graphical rectangles of white and black light, with sticks on top and bottom. When analyzing each candle in detail, you will see its characteristics of a relative period: the opening price, closing price, and maximum and minimum prices.
Horizontal levels are price coordinates, relative to which a stop or a price reversal may occur. These levels are called support and resistance in the market.
Circles and rectangles are highlighted examples where the price of the story unfolded. This color selection indicates horizontal lines that may put pressure on the quote in the future.
The up/down arrows are the reference points of the possible price direction in the future.
*这里的市场分析是为了增加您对市场的了解,而不是给出交易的指示。
InstaSpot分析评论将让您充分了解市场趋势! 作为InstaSpot的客户,您将获得大量的免费服务以实现有效的交易。


