


我们的团队有超过700万的操盘手!
我们每天都在一起努力改善交易。我们得到了很高的成绩,并继续前进。
世界各地数以百万计的操盘手的认可是我们工作的最大赞赏! 您做出了您的选择,我们将尽一切努力来满足您的期望!
我们是一个共同的伟大团队!
InstaSpot. 自豪地为您工作!


EU industrial production data showed an acceleration in the growth rate from 2.8% to 4.9%, with forecast at 3.3%. This positive news stimulated the euro to further strengthen.
As for the US ballot count, the preliminary totals are:
House of Representatives: Democrats 205 - Republicans 217. Control requires 218 seats out of 435.
Senate: Democrats 50 - Republicans 49. Control requires 51 seats out of 100.
In fact, the Senate is already for the Democrats, and the House of Representatives for the Republicans.
The data is not final, the ballots are still being counted.
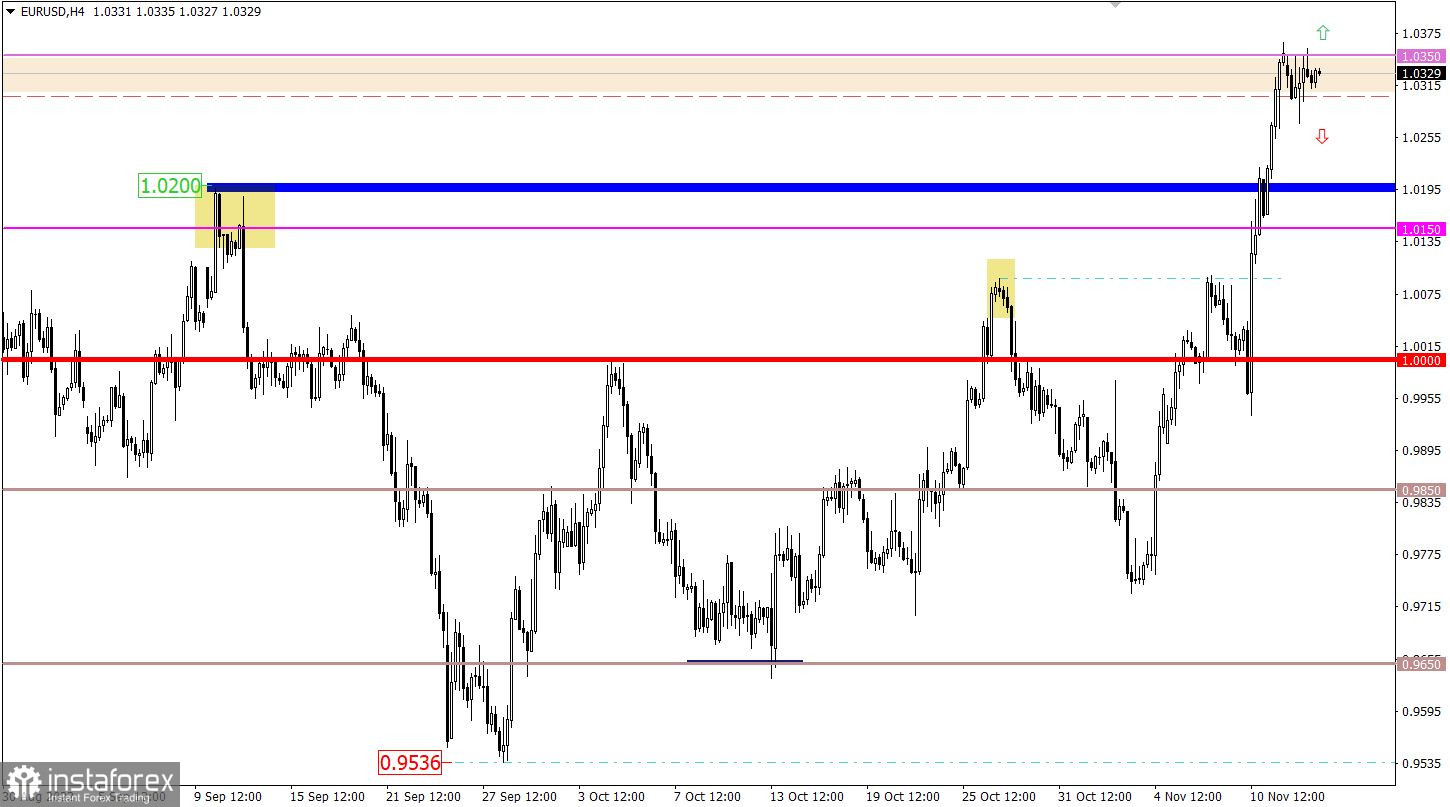
The EURUSD currency pair slowed the upward cycle around the level of 1.0350, relative to which there was a stagnation within 50–60 points. The current stop could well become a process of accumulation of trading forces, which, in turn, may indicate a new round of activity in the market.
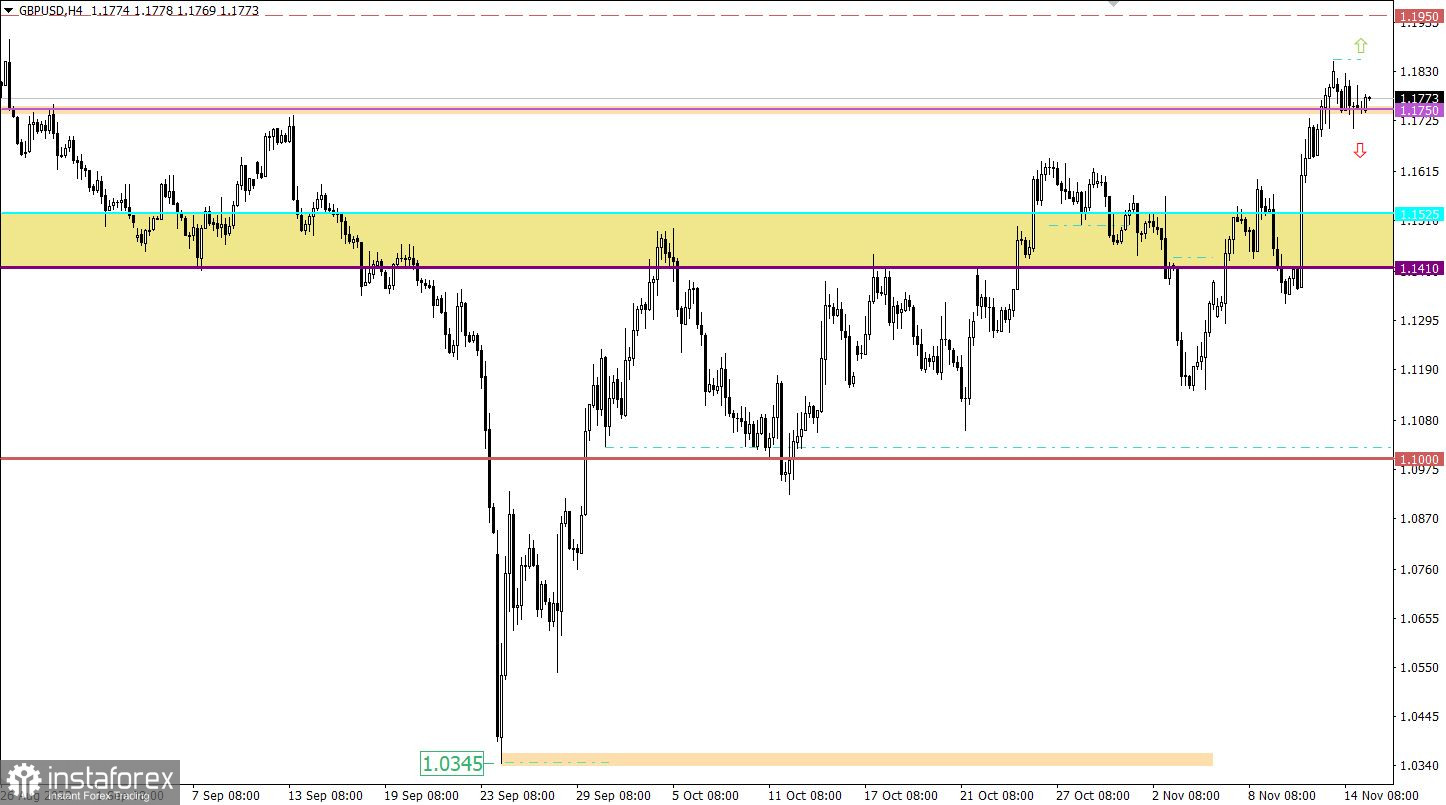
The GBPUSD currency pair has slowed the construction of the inertial move around the value of 1.1850. As a result, there was a pullback to the previously passed level 1.1750, relative to which there was a stagnation.

Since the opening of the European session, data on the UK labor market have been published, which came out worse than forecasts. The unemployment rate rose from 3.5% to 3.6%, while forecasts assumed maintaining the previous level. A negative factor in the report is also a reduction in employment by 52,000, with a forecast of 25,000.
Despite the negative factors, the pound sterling is maintaining its position in the market.
In Europe, the publication of data on GDP for the third quarter is expected, where they expect the economy to slow down. This is a negative factor for the EU.
EU GDP – 10:00 UTC
In this situation, the stagnation along the level of 1.1750 may serve as a process of accumulation of trading forces, which will eventually lead to new speculative price jumps.
The upside scenario will be relevant if the price holds above 1.1850 in a four-hour period. This step will restart the inertial move and increase the volume of long positions.
The downside scenario will become relevant if the price holds below 1.1680 in a four-hour period. In this case, a reverse movement is possible in the direction of the area of interaction of trade forces 1.1410/1.1525.
Presumably, the current stagnation is only a local manifestation of the price, which will soon become a lever for new speculation.
For this reason, the tactics of the outgoing impulse regarding stagnation are considered.
The upside scenario will be applied in case the price holds above the level of 1.0350 in a four-hour period.
Traders will consider a downside scenario if the price returns below 1.0260.
A candlestick chart view is graphical rectangles of white and black light, with sticks on top and bottom. When analyzing each candle in detail, you will see its characteristics of a relative period: the opening price, closing price, and maximum and minimum prices.
Horizontal levels are price coordinates, relative to which a stop or a price reversal may occur. These levels are called support and resistance in the market.
Circles and rectangles are highlighted examples where the price of the story unfolded. This color selection indicates horizontal lines that may put pressure on the quote in the future.
The up/down arrows are the reference points of the possible price direction in the future.
*这里的市场分析是为了增加您对市场的了解,而不是给出交易的指示。
InstaSpot分析评论将让您充分了解市场趋势! 作为InstaSpot的客户,您将获得大量的免费服务以实现有效的交易。


