


我们的团队有超过700万的操盘手!
我们每天都在一起努力改善交易。我们得到了很高的成绩,并继续前进。
世界各地数以百万计的操盘手的认可是我们工作的最大赞赏! 您做出了您的选择,我们将尽一切努力来满足您的期望!
我们是一个共同的伟大团队!
InstaSpot. 自豪地为您工作!


The macroeconomic calendar was empty, which did not interest traders since all the attention was on counting ballots.
House of Representatives: Democrats 184 - Republicans 207. Control requires 218 seats out of 435.
Senate: Democrats 48 - Republicans 48. Control requires 51 seats out of 100.
The data is not final, the ballots are still being counted.
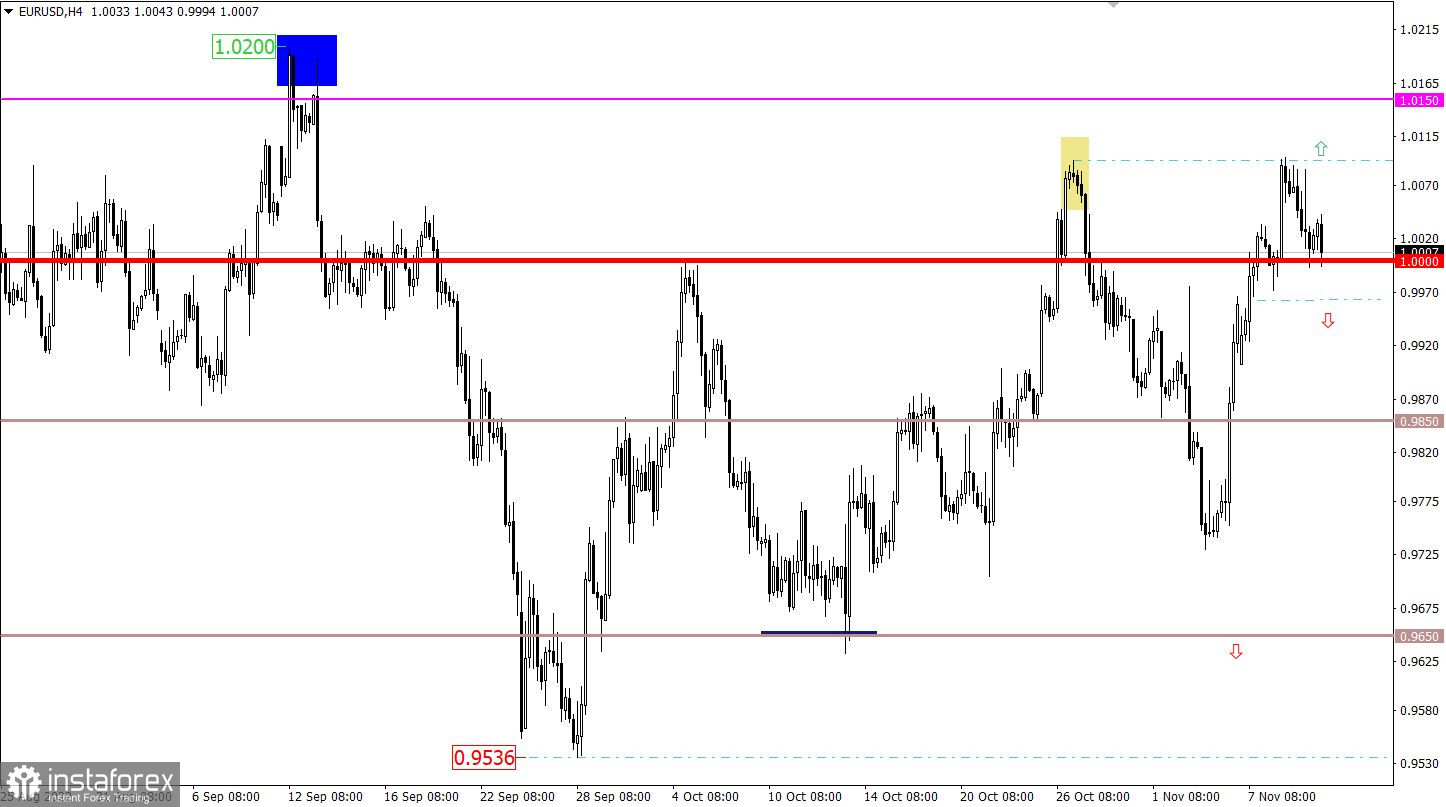
The EURUSD currency pair rebounded from the area of the local high in October with surgical precision. As a result, there was a pullback in the direction of the parity level.
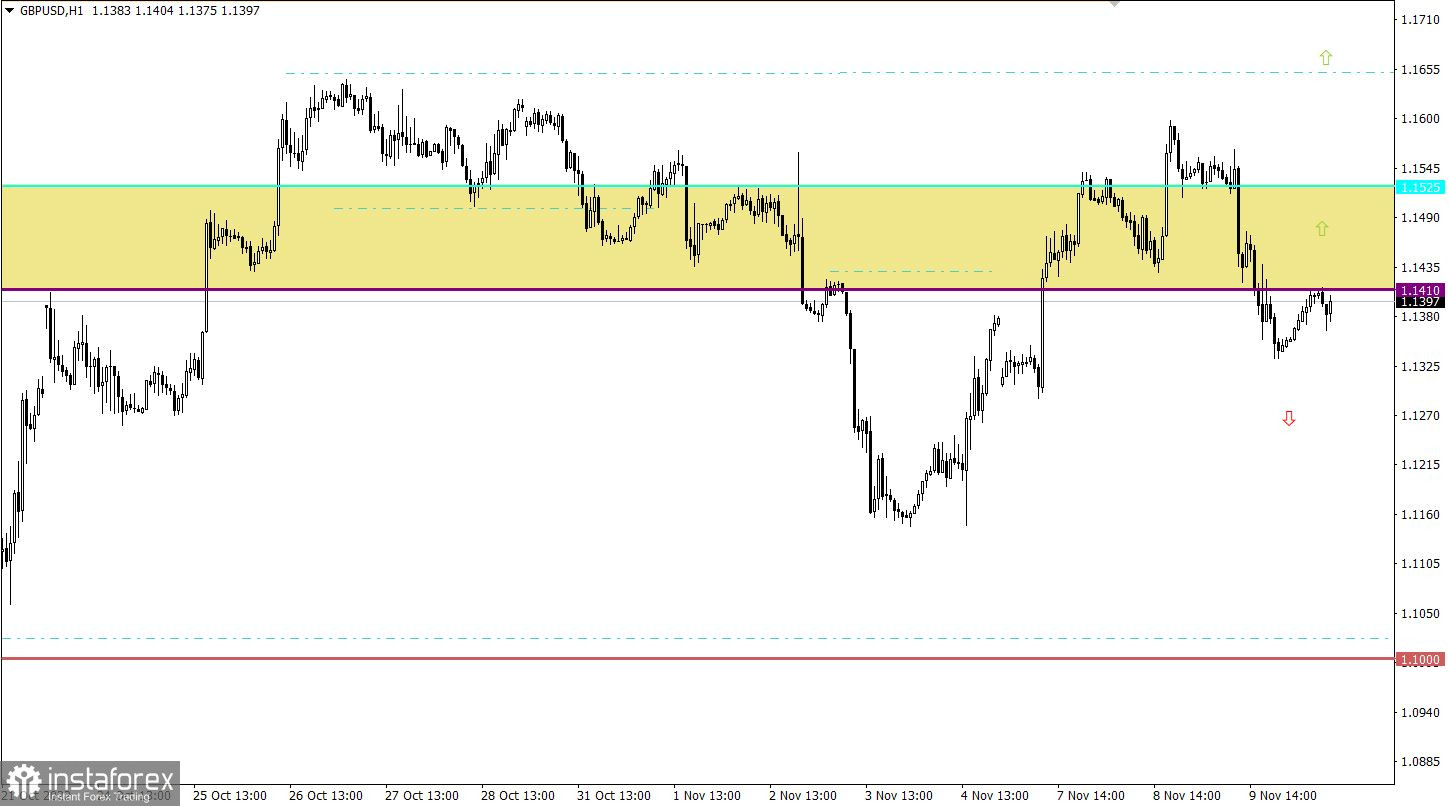
The GBPUSD currency pair showed a fairly active attitude during the past day, due to which the quote dropped by about 200 points. As a result, the pound went below 1.1400, which aggravated short positions. In fact, as of writing, there was a technical signal about the oversold value of the pound sterling in short-term time periods. This, in turn, led to a pullback during the Pacific and Asian sessions.

Today, once data on ballot counting is finalized, there may be activity in the media regarding the results. Also, the focus will be on data on inflation in the United States, which may decrease from 8.2% to 8.0%, which will be the fourth consecutive decline in inflation. If these forecasts coincide, this may calm the market somewhat regarding the pace of interest rate hikes. In this case, the US stock market will move to growth, and the dollar will sell off.
Time targeting:
US Inflation – 13:30 UTC
In this situation, the parity level serves as support in the market. Thus, strengthening of long positions is possible. The subsequent intensive growth of the euro is expected only after holding the price above the October local high in a four-hour period.
As for the downward scenario, for its consideration, the quote must first hold below 0.9950. This price move may restart short positions.
Now a lot will depend on how speculators behave against the background of the information and news flow. From a technical analysis point of view, the situation is as follows: the upward scenario will be considered by traders if the price returns above 1.1450; the downward scenario will be relevant if the price stays below 1.1300.
A candlestick chart view is graphical rectangles of white and black light, with sticks on top and bottom. When analyzing each candle in detail, you will see its characteristics of a relative period: the opening price, closing price, and maximum and minimum prices.
Horizontal levels are price coordinates, relative to which a stop or a price reversal may occur. These levels are called support and resistance in the market.
Circles and rectangles are highlighted examples where the price of the story unfolded. This color selection indicates horizontal lines that may put pressure on the quote in the future.
The up/down arrows are the reference points of the possible price direction in the future.
*这里的市场分析是为了增加您对市场的了解,而不是给出交易的指示。
InstaSpot分析评论将让您充分了解市场趋势! 作为InstaSpot的客户,您将获得大量的免费服务以实现有效的交易。


