


The legend in the InstaSpot team!
Legend! You think that's bombastic rhetoric? But how should we call a man, who became the first Asian to win the junior world chess championship at 18 and who became the first Indian Grandmaster at 19? That was the start of a hard path to the World Champion title for Viswanathan Anand, the man who became a part of history of chess forever. Now one more legend in the InstaSpot team!


Borussia is one of the most titled football clubs in Germany, which has repeatedly proved to fans: the spirit of competition and leadership will certainly lead to success. Trade in the same way that sports professionals play the game: confidently and actively. Keep a "pass" from Borussia FC and be in the lead with InstaSpot!
Overview :
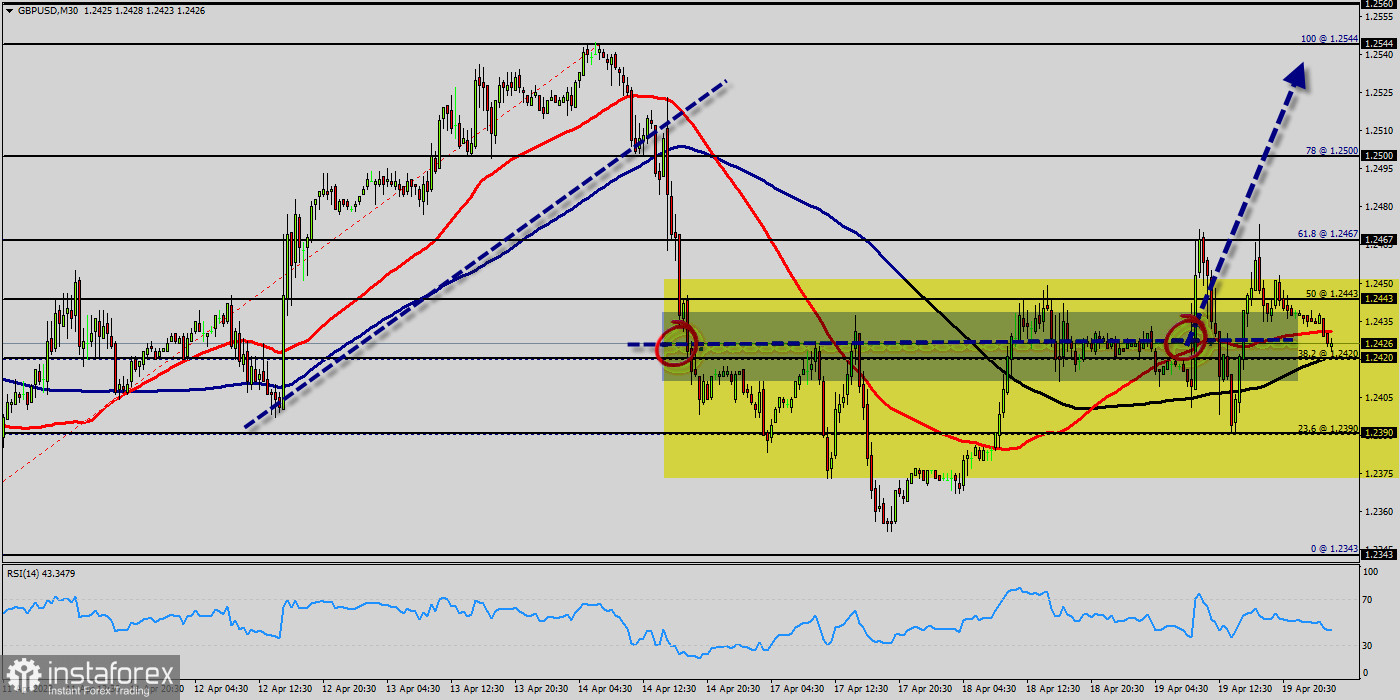
The GBP/USD pair continues to move upwards from the level of 1.2390. According to the previous events, the GBP/USD pair is still moving between the levels of 1.2390 and 1.2427; for that we expect a range of 110 pips (1.2500 - 1.2390). On the one-hour chart, immediate support level is seen at 1.2390, which coincides with a ratio of 23.6% Fibonacci retracement.
Currently, the price is moving in a bullish channel. This is confirmed by the RSI indicator signaling that we are still in a bullish trending market. The price is still above the moving average (100) and (50). Therefore, if the trend is able to break out through the first resistance level of 1.2443, we would see the pair climbing towards the daily resistance at 1.2500 to test it. It would also be wise to consider where to place stop loss; this should be set below the second support of 1.2343.
It should always be noted that: If the trend is upward, the strength of the currency will be defined as follows: GBPis in an uptrend and USD is in a downtrend. The stop loss should never exceed your maximum exposure amounts. The market is highly volatile if the last day had huge volatility.
Signal :
According to the previous events, the price of the GBP/USD pair has been still trading between the levels of 1.2343 and 1.2500. The level of 1.2544 is representing the double top and the weekly support one has set at the same price. Buy above the spot of 1.2420 with the targets 1.2427 and 1.2544. On the other hand, the daily strong support is seen at 1.2390. If the GB/USD pair is able to break out the level of 1.2390, the market will decline further to 1.2303.
*这里的市场分析是为了增加您对市场的了解,而不是给出交易的指示。
InstaSpot分析评论将让您充分了解市场趋势! 作为InstaSpot的客户,您将获得大量的免费服务以实现有效的交易。


