


The legend in the InstaSpot team!
Legend! You think that's bombastic rhetoric? But how should we call a man, who became the first Asian to win the junior world chess championship at 18 and who became the first Indian Grandmaster at 19? That was the start of a hard path to the World Champion title for Viswanathan Anand, the man who became a part of history of chess forever. Now one more legend in the InstaSpot team!


Borussia is one of the most titled football clubs in Germany, which has repeatedly proved to fans: the spirit of competition and leadership will certainly lead to success. Trade in the same way that sports professionals play the game: confidently and actively. Keep a "pass" from Borussia FC and be in the lead with InstaSpot!
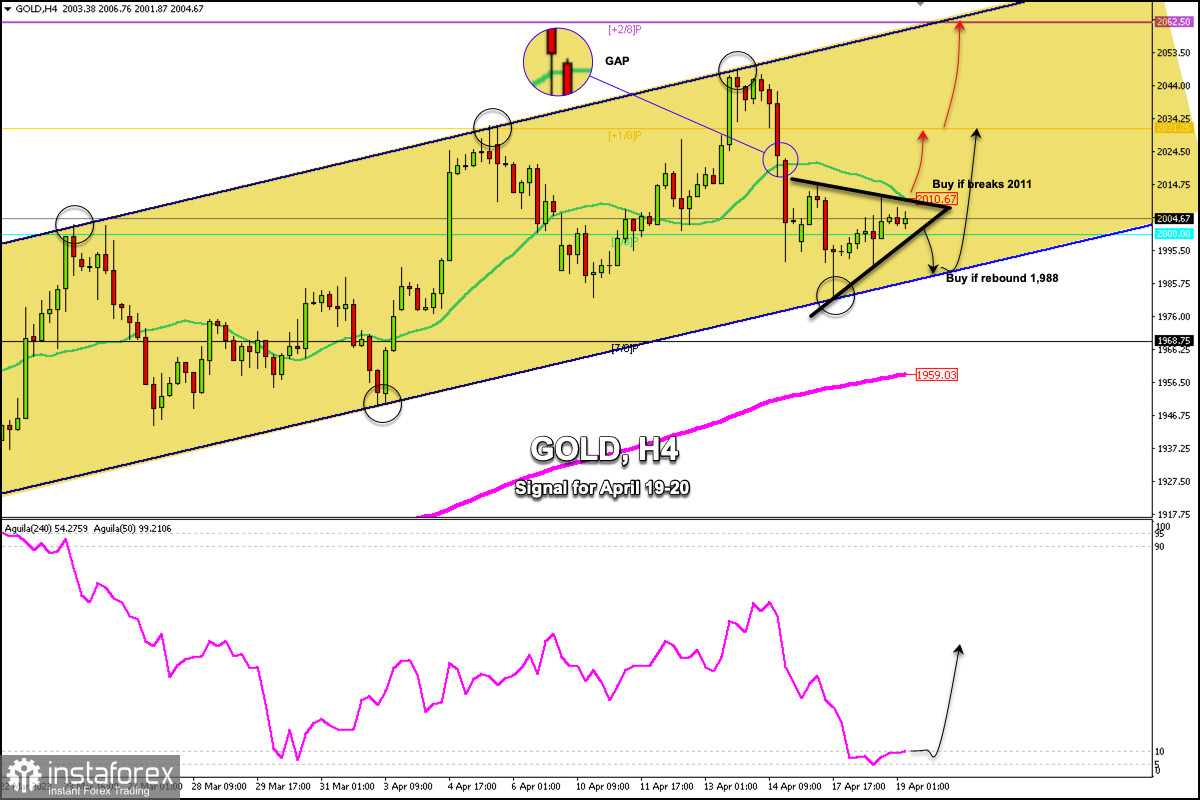
Early in the European session, Gold (XAU/USD) is trading around 2,004.67 below the 21 SMA (2,010.67) and within the symmetrical triangle pattern. We can see that the bullish force is running out and a technical correction is likely if the instrument trades below 2,010.
Gold struggled to consolidate above 2,010 but failed because the top of the symmetrical triangle pattern acted as a barrier. In the next few hours, we expect it to fall towards the 1,988 zone, a level that coincides with the bottom of the uptrend channel formed in March.
In case gold makes a sharp break above the symmetrical triangle and consolidates above the 21 SMA (2,010), we could expect an upward acceleration and it can cover the gap that it left around 2,023. Finally, it could reach +1/8 Murray located at 2,031.
If a bullish force prevails, it is likely that gold could rally above 2,031 and it could reach the top of the uptrend channel around 2,062.50.
On the other hand, in case of a break below the uptrend channel and consolidation below 1,985, we expect the metal to fall towards the 7/8 Murray located at 1,968 and finally could reach the 200 EMA located at 1,959.
On April 17, the Eagle indicator reached the extremely oversold zone of around 5 points. This could mean that any technical correction could be seen as a signal to buy only if gold consolidates above 1,985.
*这里的市场分析是为了增加您对市场的了解,而不是给出交易的指示。
InstaSpot分析评论将让您充分了解市场趋势! 作为InstaSpot的客户,您将获得大量的免费服务以实现有效的交易。


