


The legend in the InstaSpot team!
Legend! You think that's bombastic rhetoric? But how should we call a man, who became the first Asian to win the junior world chess championship at 18 and who became the first Indian Grandmaster at 19? That was the start of a hard path to the World Champion title for Viswanathan Anand, the man who became a part of history of chess forever. Now one more legend in the InstaSpot team!


Borussia is one of the most titled football clubs in Germany, which has repeatedly proved to fans: the spirit of competition and leadership will certainly lead to success. Trade in the same way that sports professionals play the game: confidently and actively. Keep a "pass" from Borussia FC and be in the lead with InstaSpot!
Details of the economic calendar for August 22
Monday was traditionally accompanied by a blank macroeconomic calendar. Important statistics in Europe, the United Kingdom, and the United States were not released.
Despite the lack of statistical data, the market behaves speculatively. There is an assumption that market participants, working ahead of the curve, include in the price all sorts of conjectures regarding Jerome Powell's Friday speech at the economic symposium in Jackson Hole.
In simple words, market participants are pouring into the US dollar, but a reversal will occur only during the symposium.
The above words are only a theory, but in this case, when the economic calendar is empty and the dollar is overbought, the theory looks quite realistic.
Analysis of trading charts from August 22
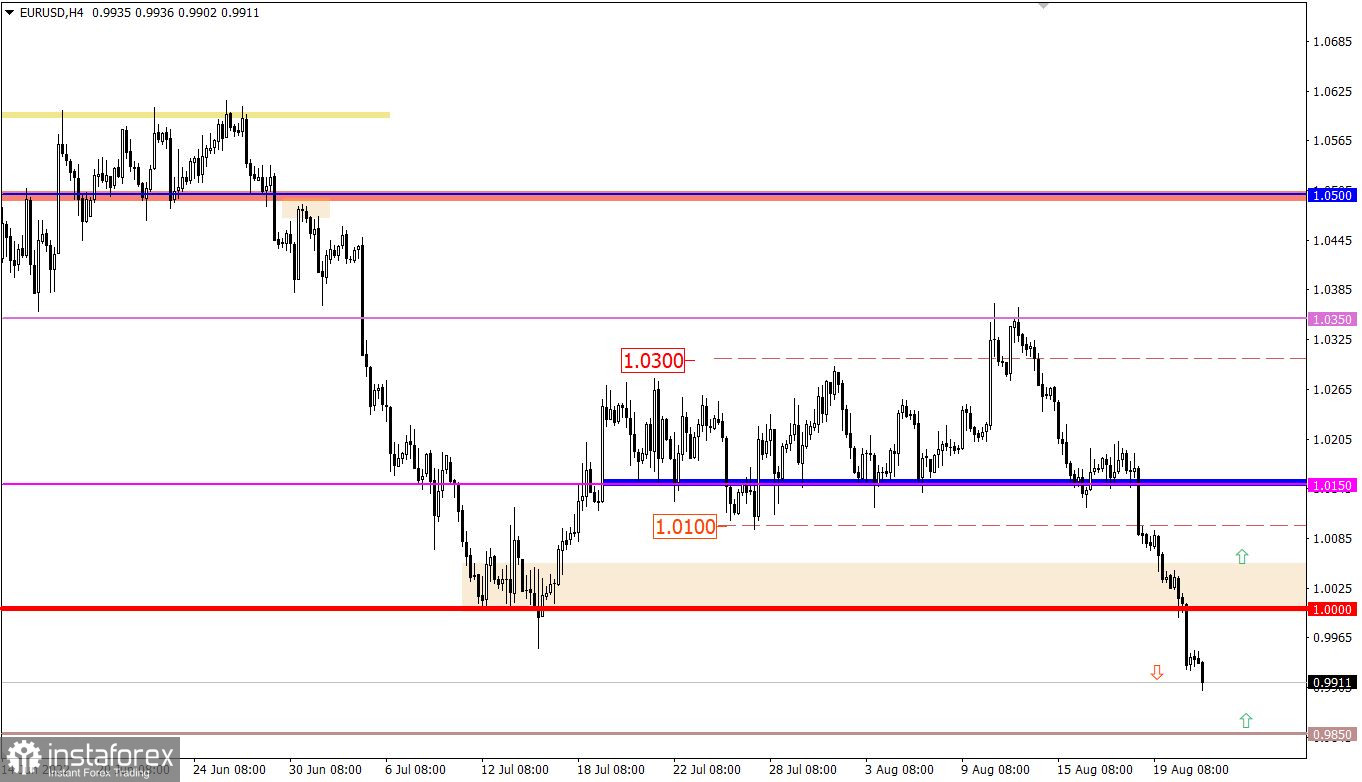
The EURUSD currency pair, during the inertial movement, managed not only to overcome the parity level, but also updated the local low of the medium-term trend. As a result, the quote was again at the levels of 2002.
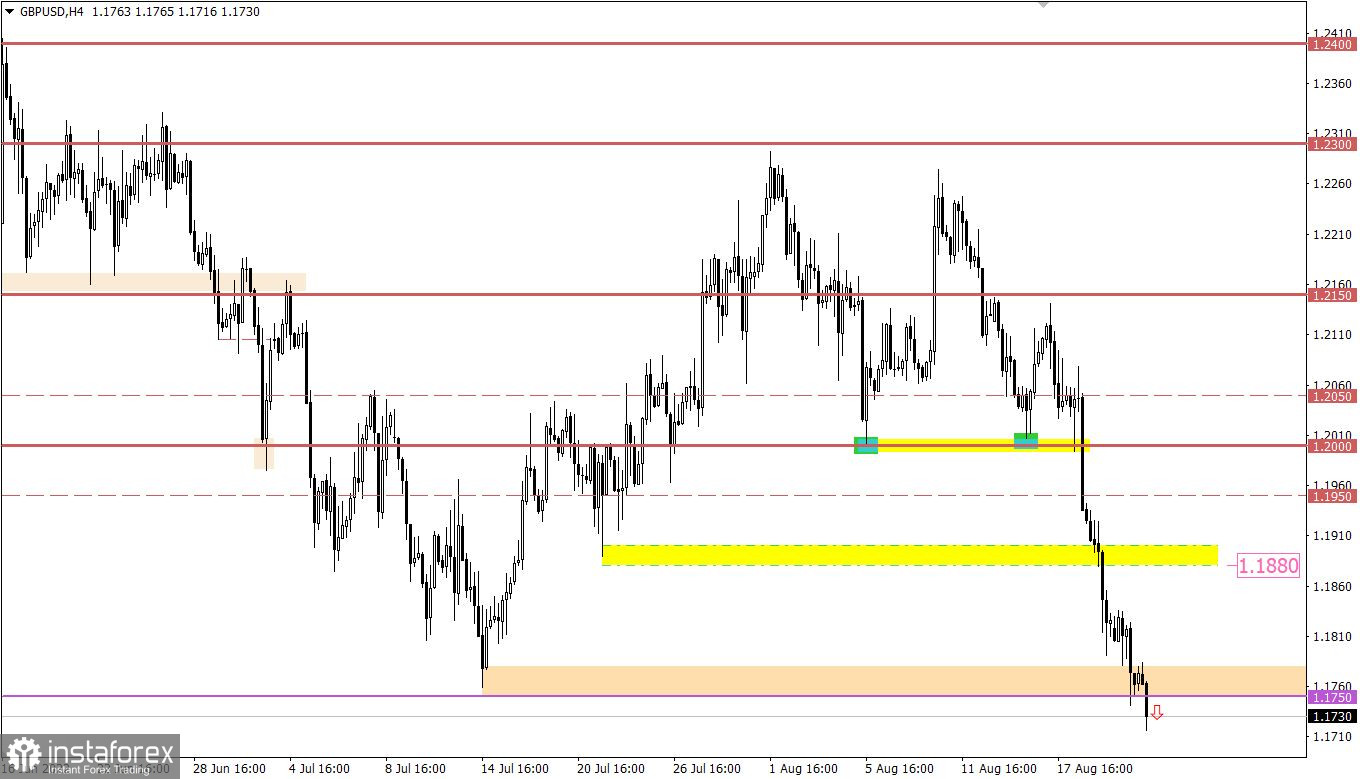
The GBPUSD currency pair, following the EURUSD, also rushed down. As a result, the local low of the medium-term trend was updated. The area of 1.1750 served as variable support on the way of sellers, relative to which there was a temporary reduction in the volume of short positions in the pound sterling, which led to a regrouping of trading forces.
Based on the analysis of a basket of currencies (EURUSD, GBPUSD, USDJPY, USDCHF, USDCAD, AUDUSD, NZDUSD), there is a general increase in dollar positions in the market.
Economic calendar for August 23
Today, preliminary data on business activity indices in Europe, the United Kingdom, and the United States are to be released, where only positive statistics are expected for the United States. Thus, the dollar may still be of interest to investors despite its overbought status.
Time targeting:
EU Manufacturing PMI - 08:00 UTC (Previous: 49.8 points ---> Forecast: 48.0 points)
EU Services PMI - 08:00 UTC (Previous: 51.2 points ---> Forecast: 50.5 points)
UK Manufacturing PMI - 08:30 UTC (Previous: 52.1 points ---> Forecast: 51.0 points)
UK Services PMI - 08:30 UTC (Previous: 52.6 points ---> Forecast: 52.0 points)
US Manufacturing PMI - 13:45 UTC (Previous: 52.2 points ---> Forecast: 52.0 points)
US Services PMI - 13:45 UTC (Previous: 47.3 points ---> Forecast: 49.2 points)
Trading plan for EUR/USD on August 23
In this situation, much will depend on the speculative mood of market participants since technical instruments indicate overheating of short positions in the euro. This should lead to a technical pullback. Note that this is only a theory of technical analysis because, in practice, these signals can easily be ignored by traders, and the quote will continue to decline.
We concretize the above:
The parity level (1.0000) no longer plays a proper role in the market. Traders simply do not pay attention to it in terms of reducing the volume of short positions. Now there are a number of important marks on the way of sellers—these are 0.9850 and 0.9650. Previously, it was a side channel located below the parity level.
In our case, these are coordinates relative to which market participants can interact with the price. In simple words—possible levels of support.
Trading plan for GBP/USD on August 23
Stable price retention below 1.1750 for at least a four-hour period may lead to a subsequent decline in the value of the British currency. In the work, it is worth considering that the pound is already losing about 500 points in value in just 1.5 weeks. This indicates an overheating of short positions, which allows the formation of a pullback or price stagnation.
What is shown in the trading charts?
A candlestick chart view is graphical rectangles of white and black light, with sticks on top and bottom. When analyzing each candle in detail, you will see its characteristics of a relative period: the opening price, closing price, and maximum and minimum prices.
Horizontal levels are price coordinates, relative to which a stop or a price reversal may occur. These levels are called support and resistance in the market.
Circles and rectangles are highlighted examples where the price of the story unfolded. This color selection indicates horizontal lines that may put pressure on the quote in the future.
The up/down arrows are the reference points of the possible price direction in the future.
*这里的市场分析是为了增加您对市场的了解,而不是给出交易的指示。
InstaSpot分析评论将让您充分了解市场趋势! 作为InstaSpot的客户,您将获得大量的免费服务以实现有效的交易。


