


The legend in the InstaSpot team!
Legend! You think that's bombastic rhetoric? But how should we call a man, who became the first Asian to win the junior world chess championship at 18 and who became the first Indian Grandmaster at 19? That was the start of a hard path to the World Champion title for Viswanathan Anand, the man who became a part of history of chess forever. Now one more legend in the InstaSpot team!


Borussia is one of the most titled football clubs in Germany, which has repeatedly proved to fans: the spirit of competition and leadership will certainly lead to success. Trade in the same way that sports professionals play the game: confidently and actively. Keep a "pass" from Borussia FC and be in the lead with InstaSpot!
Details of the economic calendar for August 11
The US dollar accelerated its decline against competitors after the release of US producer prices data, which declined from 11.3% to 9.8% in annual terms. Month-on-month indicators reflected a drop of 0.5%.
At the same time, investors were disappointed by data on the US labor market, where an increase in the volume of applications for benefits was recorded, accelerating the sale of the dollar.
Statistics details:
The volume of continuing claims for benefits increased from 1.420 million to 1.428 million.
The volume of initial claims for benefits increased from 248,000 to 262,000.
Analysis of trading charts from August 11
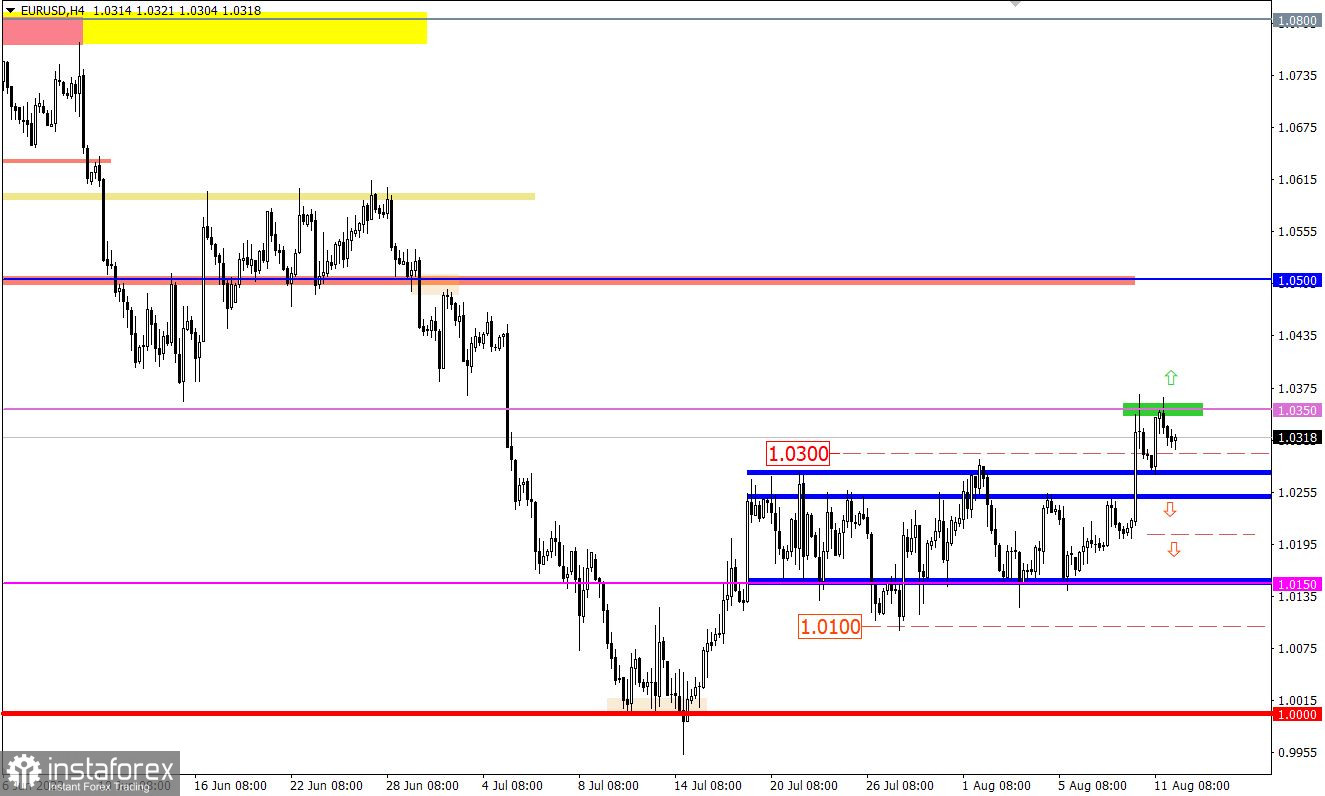
The EURUSD currency pair, during the pullback, reached the upper limit of the previously passed flat 1.0150/1.0270, where there was a reduction in the volume of short positions. As a result, the market rebounded, and the buyers again managed to return the euro rate to the area of the local high of the current corrective move.
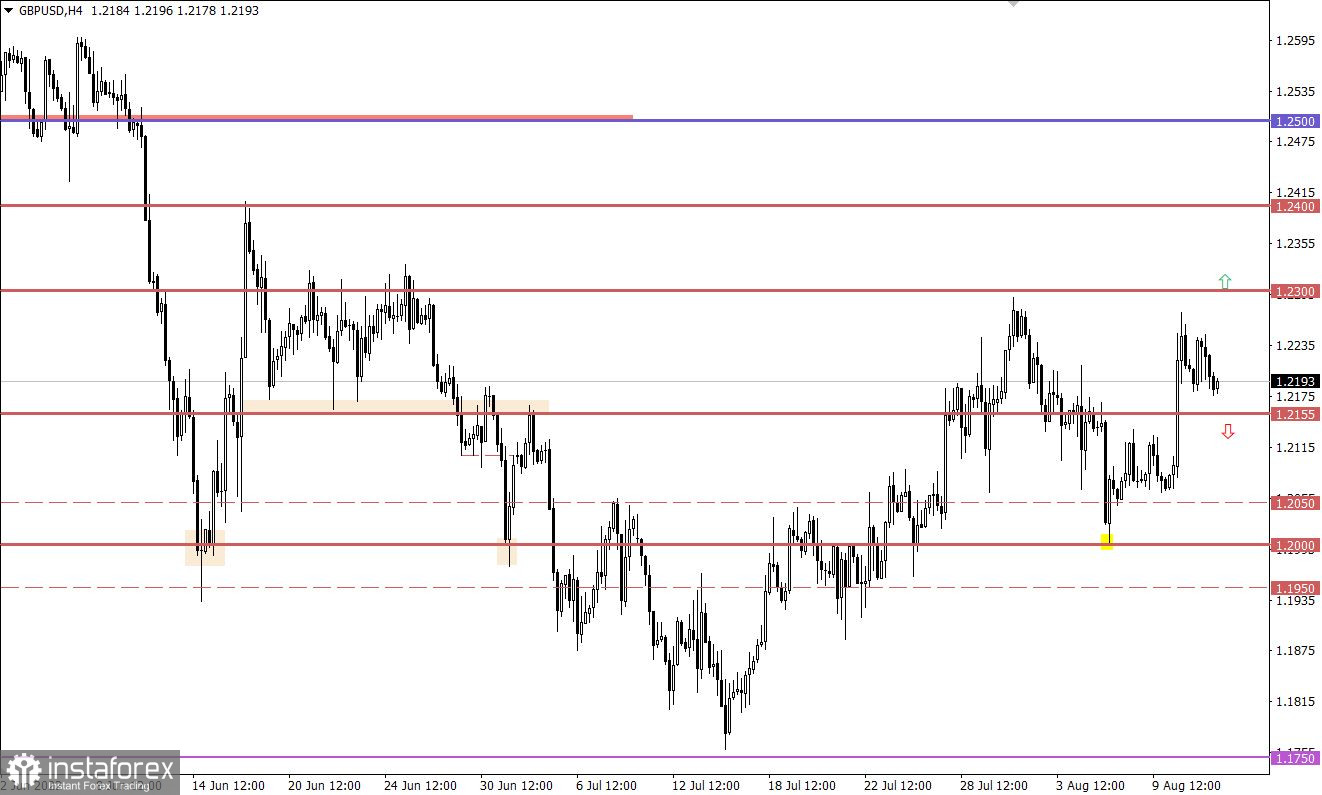
The GBPUSD currency pair, during the pullback, almost reached the level of 1.2155, around which there was a stagnation. The symbolic reduction in the volume of long positions indicated that upward interest still prevails among traders.
Economic calendar for August 12
Today, with the opening of European markets, UK GDP data for the second quarter was published, which recorded a slowdown in economic growth from 8.7% to 2.9%. In other words, the British economy is steadily slipping into recession, as the Bank of England recently warned.
In Europe, the publication of data on industrial production is not expected to be the best, the growth rate of which should slow down from 1.6% to 0.8%. This may negatively affect the euro exchange rate.
Time targeting:
EU Industrial production data – 09:00 UTC
Trading plan for EUR/USD on August 12
The upward trend is still relevant in the market. For this reason, holding the price above 1.0350 in a four-hour period will lead to the subsequent construction of a corrective move. If the forecast coincides, the euro exchange rate may gradually rise to 1.0500–1.0650.
The downward scenario will be considered by traders in case the price returns below the value of 1.0200 in a four-hour period.
Trading plan for GBP/USD on August 12
In this situation, a return of the price to the 1.2250/1.2300 area, followed by a hold above it, will lead to a prolonged upward cycle.
The downside scenario will become relevant when the price holds below 1.2150 in a four-hour period.
What is shown in the trading charts?
A candlestick chart view is graphical rectangles of white and black light, with sticks on top and bottom. When analyzing each candle in detail, you will see its characteristics of a relative period: the opening price, closing price, and maximum and minimum prices.
Horizontal levels are price coordinates, relative to which a stop or a price reversal may occur. These levels are called support and resistance in the market.
Circles and rectangles are highlighted examples where the price of the story unfolded. This color selection indicates horizontal lines that may put pressure on the quote in the future.
The up/down arrows are the reference points of the possible price direction in the future.
*这里的市场分析是为了增加您对市场的了解,而不是给出交易的指示。
InstaSpot分析评论将让您充分了解市场趋势! 作为InstaSpot的客户,您将获得大量的免费服务以实现有效的交易。


