


The legend in the InstaSpot team!
Legend! You think that's bombastic rhetoric? But how should we call a man, who became the first Asian to win the junior world chess championship at 18 and who became the first Indian Grandmaster at 19? That was the start of a hard path to the World Champion title for Viswanathan Anand, the man who became a part of history of chess forever. Now one more legend in the InstaSpot team!


Borussia is one of the most titled football clubs in Germany, which has repeatedly proved to fans: the spirit of competition and leadership will certainly lead to success. Trade in the same way that sports professionals play the game: confidently and actively. Keep a "pass" from Borussia FC and be in the lead with InstaSpot!
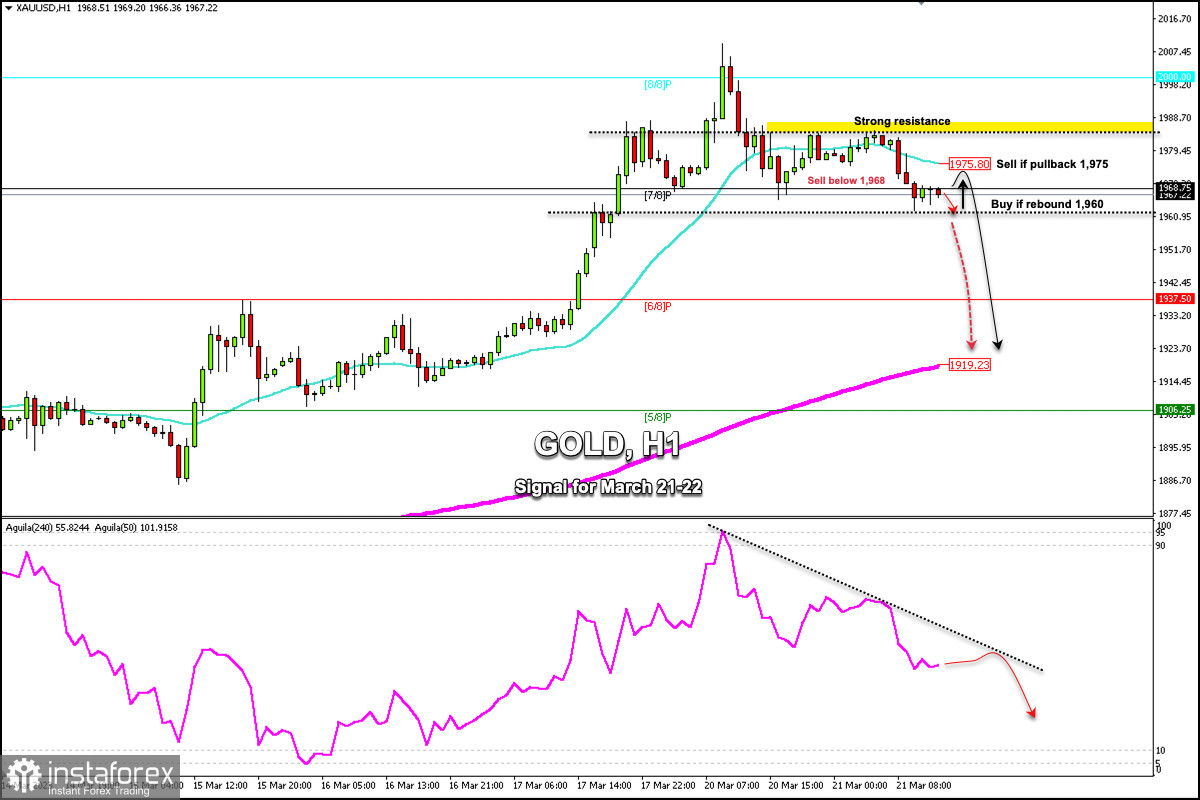
XAU/USD retreats from its annual high reached on March 20 at 2,009.66. The global banking jitters have passed for now and US Treasury yields have been bouncing, erasing Gold's strength.
According to the 1-hour chart, gold is trading below the 21 SMA located at 1,975 and below the strong resistance of 1,986. We can clearly see that the asset is under strong bearish pressure but it could find a bottom around 1,960. At this level in the 4-hour chart, we can see the 21 SMA which will act as strong support and gold could then resume the bullish cycle.
In case gold breaks out sharply and consolidates below 1,960, we would expect a bearish acceleration and the instrument could reach the 6/8 Murray at 1,937 and could ultimately reach the 200 EMA located at 1,919.
On the contrary, if gold remains above 1,960, it could give us a signal to buy with targets at 1,975 (21 SMA) and 1,986 (weekly_resistance).
Since its high reached in the last hours, gold has made a correction of almost $40 as part of profit taking. The instrument is likely to see a technical rebound in the coming hours and then continue with a short-term downtrend.
Our trading plan for the next few hours is to sell below 7/8 Murray located at 1,968, with targets at 1,960. Around this level, we can expect a technical bounce to buy with targets at 1,975. The Eagle indicator from 20 March is giving a negative signal. Hence, as long as the metal trades below 1,985, any technical bounce will be seen as a signal to sell.
*这里的市场分析是为了增加您对市场的了解,而不是给出交易的指示。
InstaSpot分析评论将让您充分了解市场趋势! 作为InstaSpot的客户,您将获得大量的免费服务以实现有效的交易。


