


我们的团队有超过700万的操盘手!
我们每天都在一起努力改善交易。我们得到了很高的成绩,并继续前进。
世界各地数以百万计的操盘手的认可是我们工作的最大赞赏! 您做出了您的选择,我们将尽一切努力来满足您的期望!
我们是一个共同的伟大团队!
InstaSpot. 自豪地为您工作!


Data on the UK labor market came out not as bad as predicted. The unemployment rate remained at 3.8%, while forecast expected growth to 3.9%. Employment in the country increased by 296,000, while jobless claims fell by 20,000 in June.
These became a catalyst for holding long positions on the pound sterling.
The main event on Tuesday was the data on inflation in the EU, which again set a record. Consumer prices in the eurozone increased by 8.6% year-on-year in June. It is worth noting that inflation exceeds the ECB's target of 2% by more than four times. Thus, at the upcoming meeting of the ECB, the regulator is likely to raise interest rates.
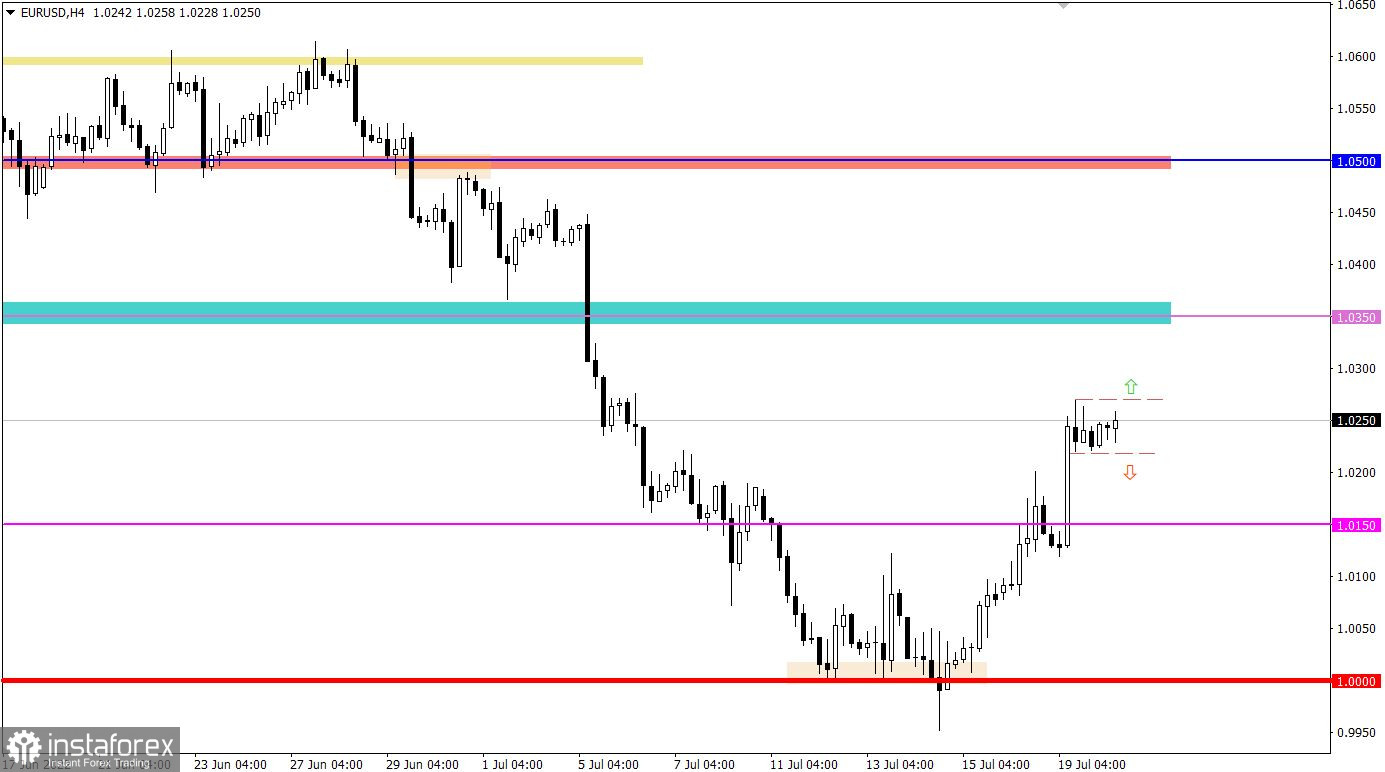
The EURUSD currency pair broke through the resistance level of 1.0150 during the corrective movement. As a result, the market experienced a subsequent increase in the volume of long positions, which led to a prolonged correction. In less than a week, the euro has strengthened in value by more than 300 points. It is a strong price movement, which may lead to an overheating of long positions in the short term.
The GBPUSD currency pair reached the psychological level of 1.2000 during the corrective movement, where it formed a stagnation within its borders. In fact, we still have a tight correlation between EURUSD and GBPUSD.
With the opening of the European session, data on inflation in the UK were published, which accelerated from 9.1% to 9.4%. It again indicates that the Bank of England may undertake a stronger increase in the interest rate at the upcoming meeting.
Stagnation at the peak of the corrective course is a process of accumulation of trading forces. As a result, a new wave of speculation will arise in the market, where, based on the price consolidation points relative to stagnation, the subsequent course of the price will be clear.
We concretize the above into trading signals:
Buy positions on the currency pair should be considered after holding the price above the value of 1.0280 in a four-hour period.
Sell positions should be considered after holding the price below 1.0200 in a four-hour period.
In this situation, the boundaries of the deviation of the psychological level 1.1950//1.2000//1.2050 are the focus of traders' attention. So, holding the price above the value of 1.2060 in a four-hour period will lead to a prolonged correction. Meanwhile, a price return below 1.1920 in a four-hour period may indicate a gradual recovery of dollar positions.
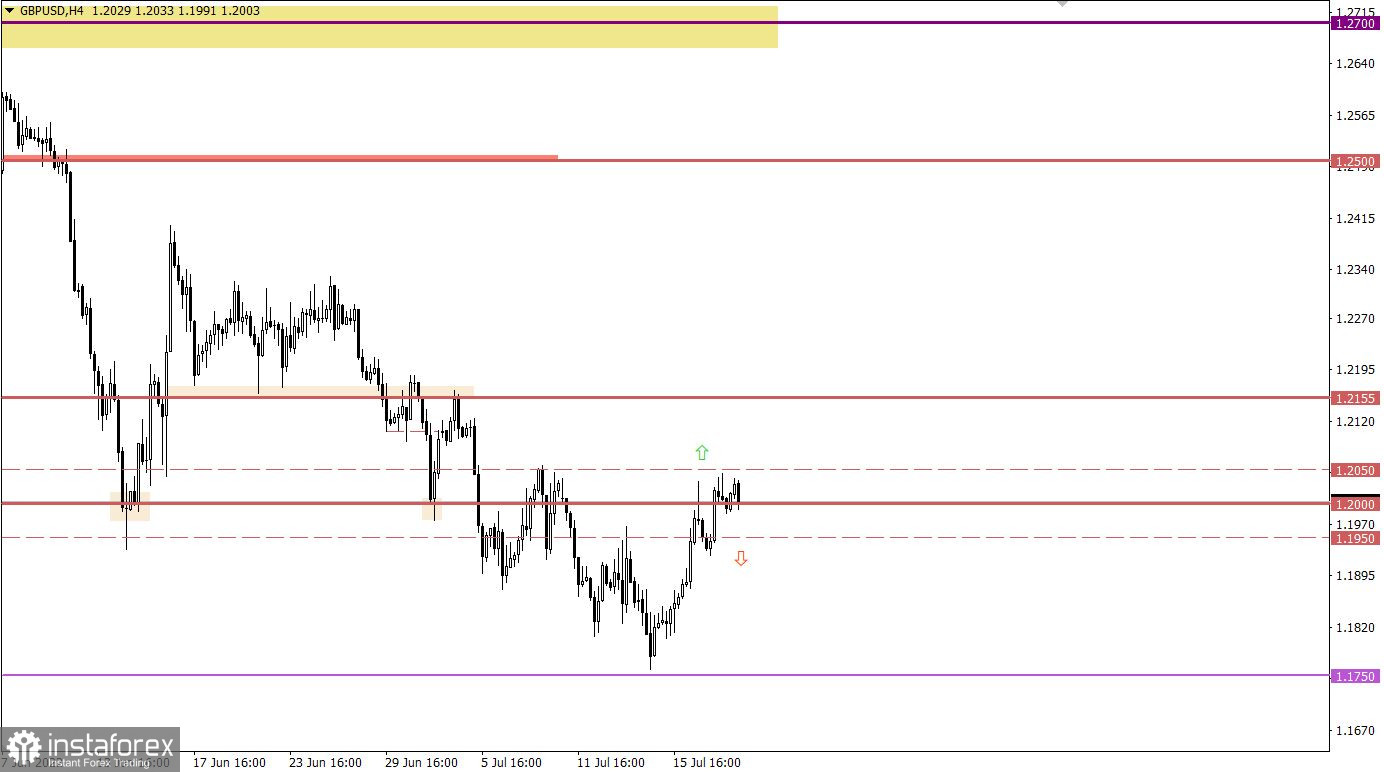
A candlestick chart view is graphical rectangles of white and black light, with sticks on top and bottom. When analyzing each candle in detail, you will see its characteristics of a relative period: the opening price, closing price, and maximum and minimum prices.
Horizontal levels are price coordinates, relative to which a stop or a price reversal may occur. These levels are called support and resistance in the market.
Circles and rectangles are highlighted examples where the price of the story unfolded. This color selection indicates horizontal lines that may put pressure on the quote in the future.
The up/down arrows are the reference points of the possible price direction in the future.
*这里的市场分析是为了增加您对市场的了解,而不是给出交易的指示。
InstaSpot分析评论将让您充分了解市场趋势! 作为InstaSpot的客户,您将获得大量的免费服务以实现有效的交易。


