


我们的团队有超过700万的操盘手!
我们每天都在一起努力改善交易。我们得到了很高的成绩,并继续前进。
世界各地数以百万计的操盘手的认可是我们工作的最大赞赏! 您做出了您的选择,我们将尽一切努力来满足您的期望!
我们是一个共同的伟大团队!
InstaSpot. 自豪地为您工作!


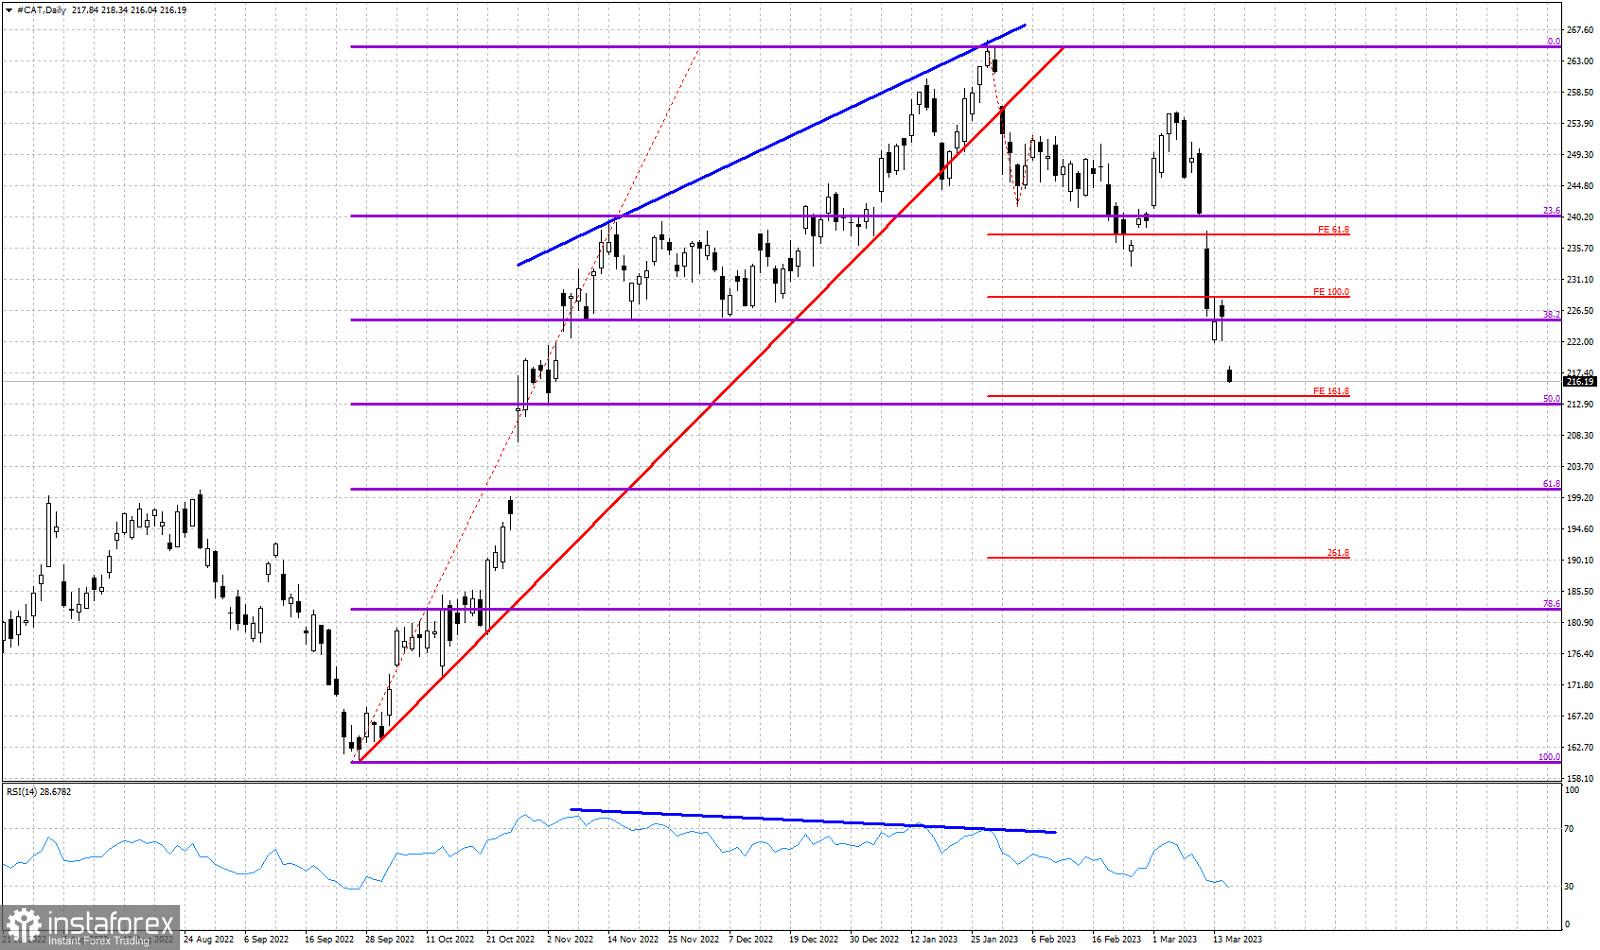
Blue lines- bearish divergence
Red lines horizontal- Fibonacci extension targets
Red upward line- support trend line (broken)
Violet lines- Fibonacci retracement levels
We have been bearish CAT stock for some time now. Price recently made a strong bounce towards $255 only to form a lower high and then turned lower to new lows. Price has now reached very close to the 161.8% Fibonacci extension target which coincides with the 61.8% Fibonacci retracement level. Short-term trend remains bearish as price continues making lower lows and lower highs. The 61.8% Fibonacci level is considered important support and possible bounce/turn around level. The RSI is still not at oversold levels. Bears remain in control of the trend.
*这里的市场分析是为了增加您对市场的了解,而不是给出交易的指示。
InstaSpot分析评论将让您充分了解市场趋势! 作为InstaSpot的客户,您将获得大量的免费服务以实现有效的交易。


