


我们的团队有超过700万的操盘手!
我们每天都在一起努力改善交易。我们得到了很高的成绩,并继续前进。
世界各地数以百万计的操盘手的认可是我们工作的最大赞赏! 您做出了您的选择,我们将尽一切努力来满足您的期望!
我们是一个共同的伟大团队!
InstaSpot. 自豪地为您工作!


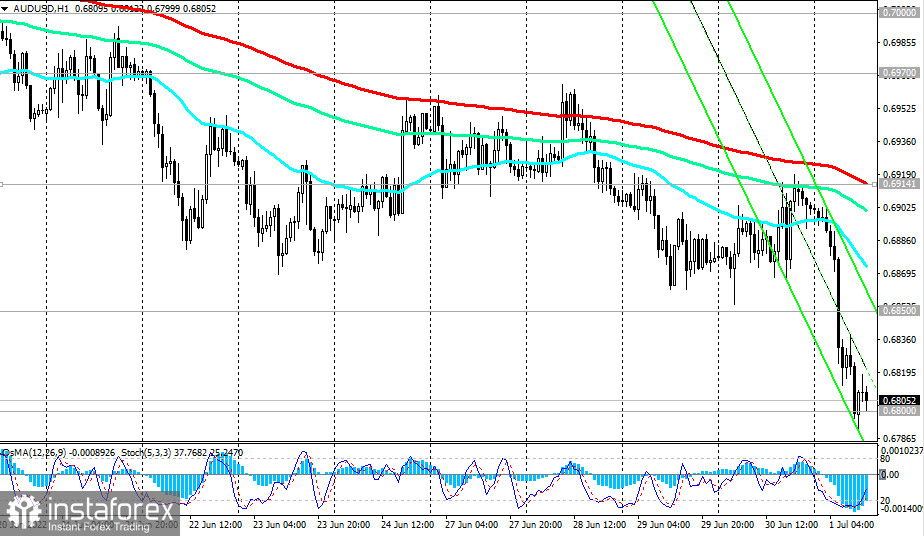
At the beginning of today's European trading session, AUD/USD reached a new local and 25-month low of 0.6790.
The main driver of the decline in AUD/USD is the Fed's monetary policy, the most stringent (at the moment) in comparison with other major world central banks.
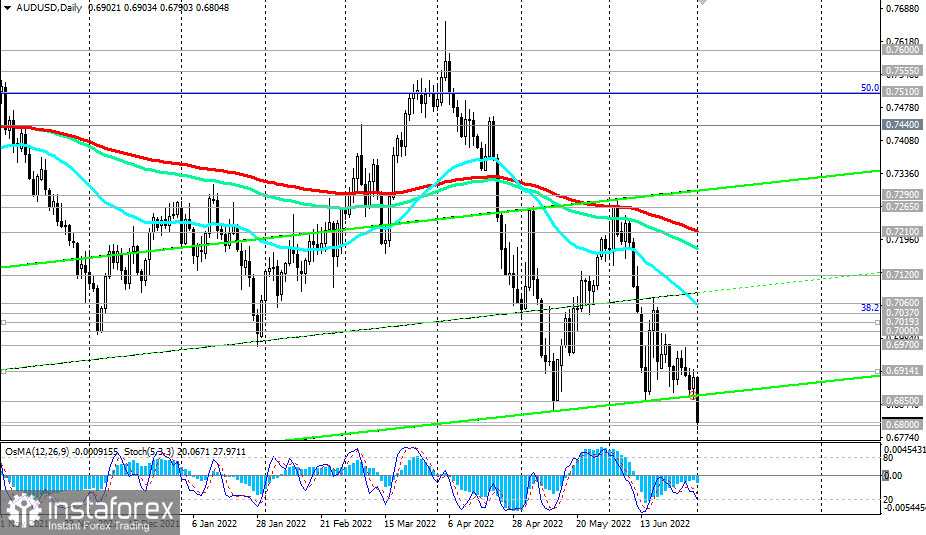
AUD/USD continues to decline towards the lower border of the descending channel on the daily chart, which is currently passing near the 0.6700 mark.
In view of the Fed's tendency to pursue a tighter monetary policy, in anticipation of further strengthening of the US dollar and given the average daily volatility of AUD/USD 60-70 points, most likely, the target of 0.6700 can be reached within the next 1-2 trading days, especially if the RBA disappoints the markets at its July 5 meeting.
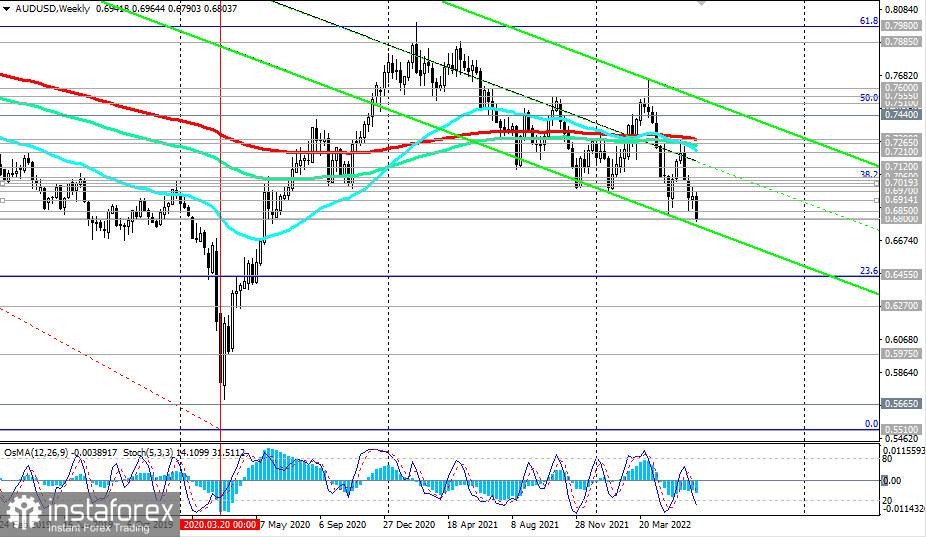
As we noted in our previous review dated 06/21/2022, a breakdown of local support levels 0.6850, and 0.6800 will confirm our assumption, and AUD/USD will head towards multi-year lows reached in March 2020 near 0.5665, 0.5510 with intermediate targets at support levels 0.6500, 0.6455 (23.6% Fibonacci retracement to the pair's decline from 0.9500 in July 2014 to 2020 lows near 0.5510), 0.6270, 0.5975.
The continued positive upward trend in US 10-year bond yields makes the dollar an attractive asset to invest in, given the prospects for further tightening of the Fed's monetary policy. The dollar is also actively used as a defensive asset, winning over traditional defensive assets such as gold, franc, and yen.
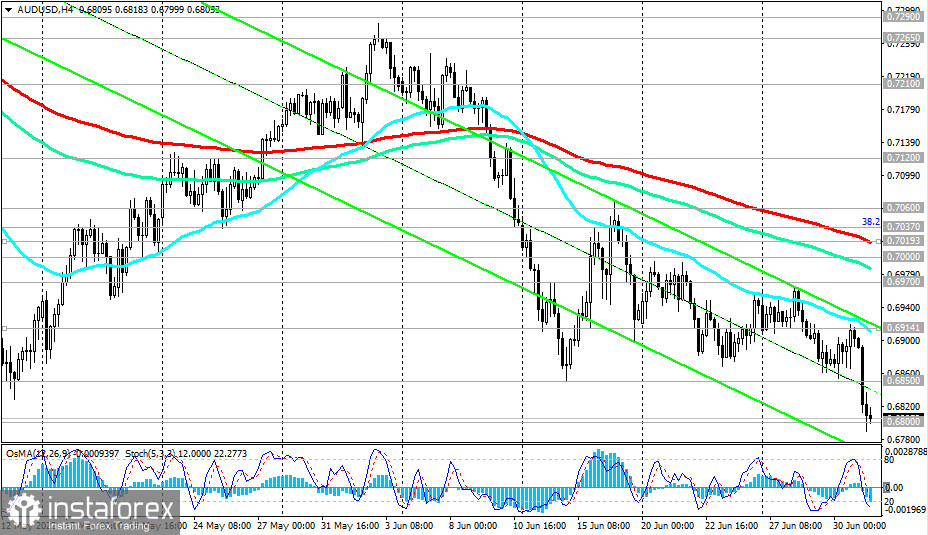
In an alternative scenario, AUD/USD will attempt a correction from the reached support level of 0.6800. In this case, the first signal to open long, for short-term positions, will be a breakdown of the local resistance level of 0.6850, and a confirming one is at a breakdown of the short-term resistance level of 0.6914 (200 EMA on the 4-hour chart). In this case, the upward correction may continue up to the resistance levels of 0.7000, 0.7019 (200 EMA on the 4-hour chart). Below the key resistance levels 0.7210 (200 EMA on the daily chart), 0.7290 (200 EMA on the weekly chart, 50 EMA on the monthly chart), AUD/USD remains in the zone of a long-term bearish market. Only a breakdown of the resistance level of 0.7600 (200 EMA on the monthly chart) will bring AUD/USD into the zone of a long-term bull market.
Support levels: 0.6800, 0.6700, 0.6500, 0.6455, 0.6270, 0.5975, 0.5665, 0.5510
Resistance levels: 0.6850, 0.6900, 0.6914, 0.6970, 0.7000, 0.7019, 0.7037, 0.7060, 0.7120, 0.7210, 0.7265, 0.7290
Trading Tips
Sell Stop 0.6780. Stop-Loss 0.6860. Take-Profit 0.6700, 0.6500, 0.6455, 0.6270, 0.5975, 0.5665, 0.5510
Buy Stop 0.6860. Stop-Loss 0.6780. Take-Profit 0.6900, 0.6914, 0.6970, 0.7000, 0.7019, 0.7037, 0.7060, 0.7120, 0.7210, 0.7265, 0.7290
*这里的市场分析是为了增加您对市场的了解,而不是给出交易的指示。
InstaSpot分析评论将让您充分了解市场趋势! 作为InstaSpot的客户,您将获得大量的免费服务以实现有效的交易。


