


The legend in the InstaSpot team!
Legend! You think that's bombastic rhetoric? But how should we call a man, who became the first Asian to win the junior world chess championship at 18 and who became the first Indian Grandmaster at 19? That was the start of a hard path to the World Champion title for Viswanathan Anand, the man who became a part of history of chess forever. Now one more legend in the InstaSpot team!


Borussia is one of the most titled football clubs in Germany, which has repeatedly proved to fans: the spirit of competition and leadership will certainly lead to success. Trade in the same way that sports professionals play the game: confidently and actively. Keep a "pass" from Borussia FC and be in the lead with InstaSpot!
The third final estimate for GDP reflected a decline of 1.6%, while the preliminary estimate was -1.5%. These data reinforce investors' fears about the slowdown in economic growth. However, in doing so, they may also force the Fed to reconsider the course of a tighter monetary policy.
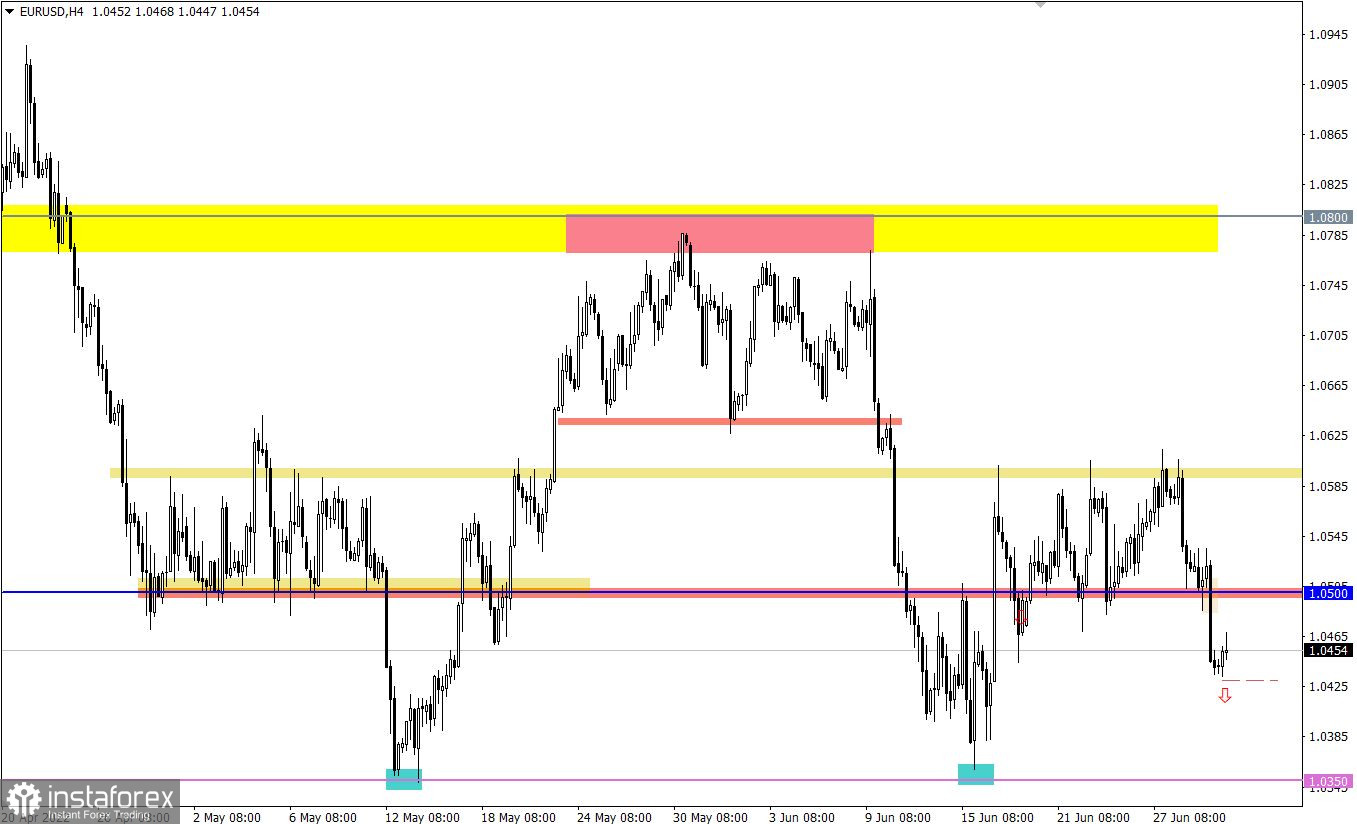
The EURUSD currency pair completed the construction of the 1.0500/1.0600 side channel by breaking its lower border. This move led to a sharp increase in the volume of short positions, which caused the euro to sell-off.
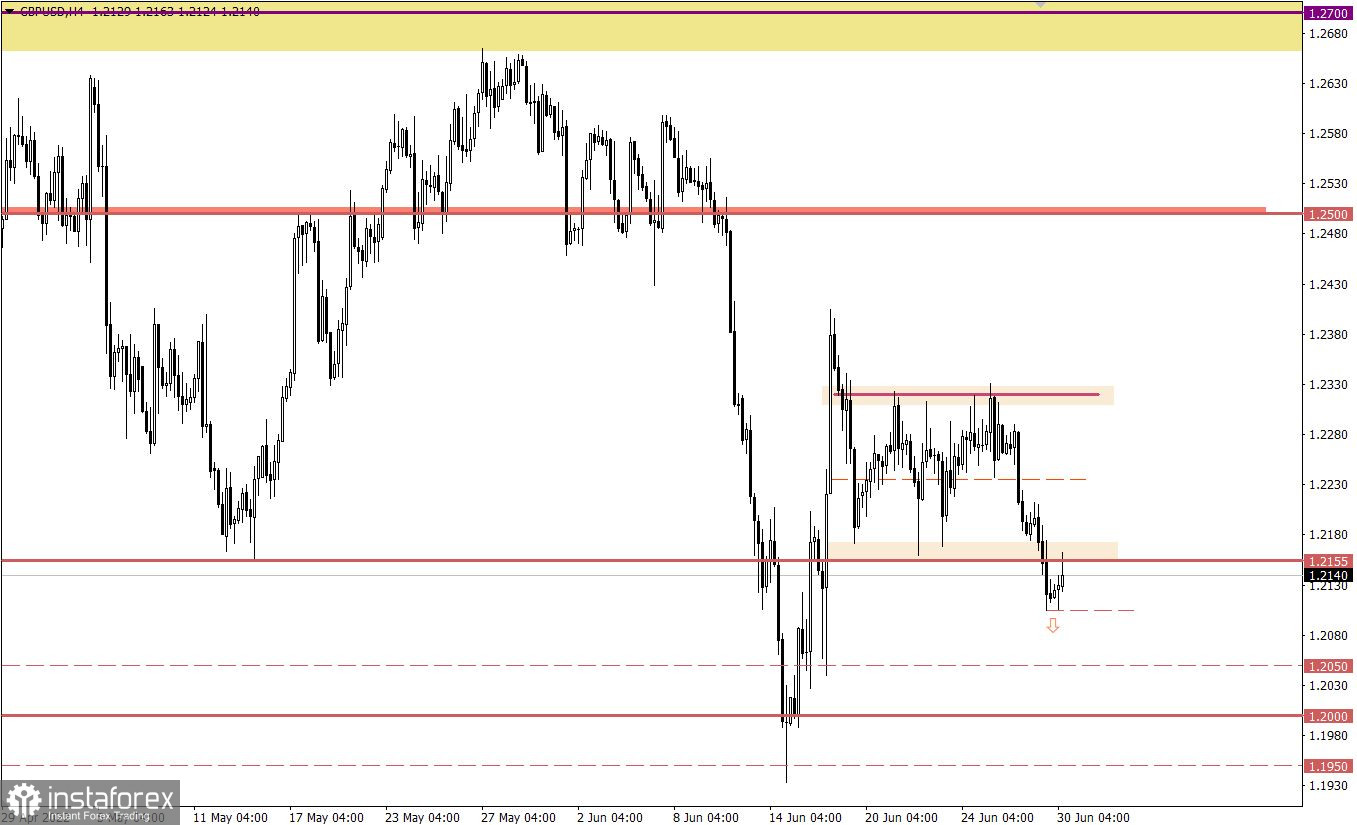
The GBPUSD currency pair rushed down through a positive correlation with EURUSD. This movement led to the breakdown of the lower border of the flat 1.2155/1.2320. As a result, the pound sterling fell to the area of 1.2100, where there was a stagnation.

Today, with the opening of the European session, final data on UK GDP were published. The figures coincided with the preliminary estimate, which means that they have already been taken into account in the quote.
During the American trading session, weekly data on jobless claims in the United States will be published, where a reduction in their volume is predicted.
Statistics details:
The volume of continuing claims for benefits may be reduced from 1.315 million to 1.310 million.
The volume of initial claims for benefits may be reduced from 229,000 to 228,000.
Time targeting
US Jobless Claims - 12:30 UTC
The stagnation caused by local overheating of short positions may lead to a regrouping of trading forces. In this case, holding the price below the value of 1.0420 in a four-hour period may strengthen the downward move towards the support level of 1.0350.
In this situation, the area of the passed level 1.2155 can play the role of resistance, increasing the downward interest. A signal of a further increase in short positions is expected after the price holds below 1.2100 in a four-hour period. In this case, sellers will have a chance to move towards the psychological level of 1.2000.
A candlestick chart view is graphical rectangles of white and black light, with sticks on top and bottom. When analyzing each candle in detail, you will see its characteristics of a relative period: the opening price, closing price, and maximum and minimum prices.
Horizontal levels are price coordinates, relative to which a stop or a price reversal may occur. These levels are called support and resistance in the market.
Circles and rectangles are highlighted examples where the price of the story unfolded. This color selection indicates horizontal lines that may put pressure on the quote in the future.
The up/down arrows are the reference points of the possible price direction in the future.
*这里的市场分析是为了增加您对市场的了解,而不是给出交易的指示。
InstaSpot分析评论将让您充分了解市场趋势! 作为InstaSpot的客户,您将获得大量的免费服务以实现有效的交易。


