


The legend in the InstaSpot team!
Legend! You think that's bombastic rhetoric? But how should we call a man, who became the first Asian to win the junior world chess championship at 18 and who became the first Indian Grandmaster at 19? That was the start of a hard path to the World Champion title for Viswanathan Anand, the man who became a part of history of chess forever. Now one more legend in the InstaSpot team!


Borussia is one of the most titled football clubs in Germany, which has repeatedly proved to fans: the spirit of competition and leadership will certainly lead to success. Trade in the same way that sports professionals play the game: confidently and actively. Keep a "pass" from Borussia FC and be in the lead with InstaSpot!
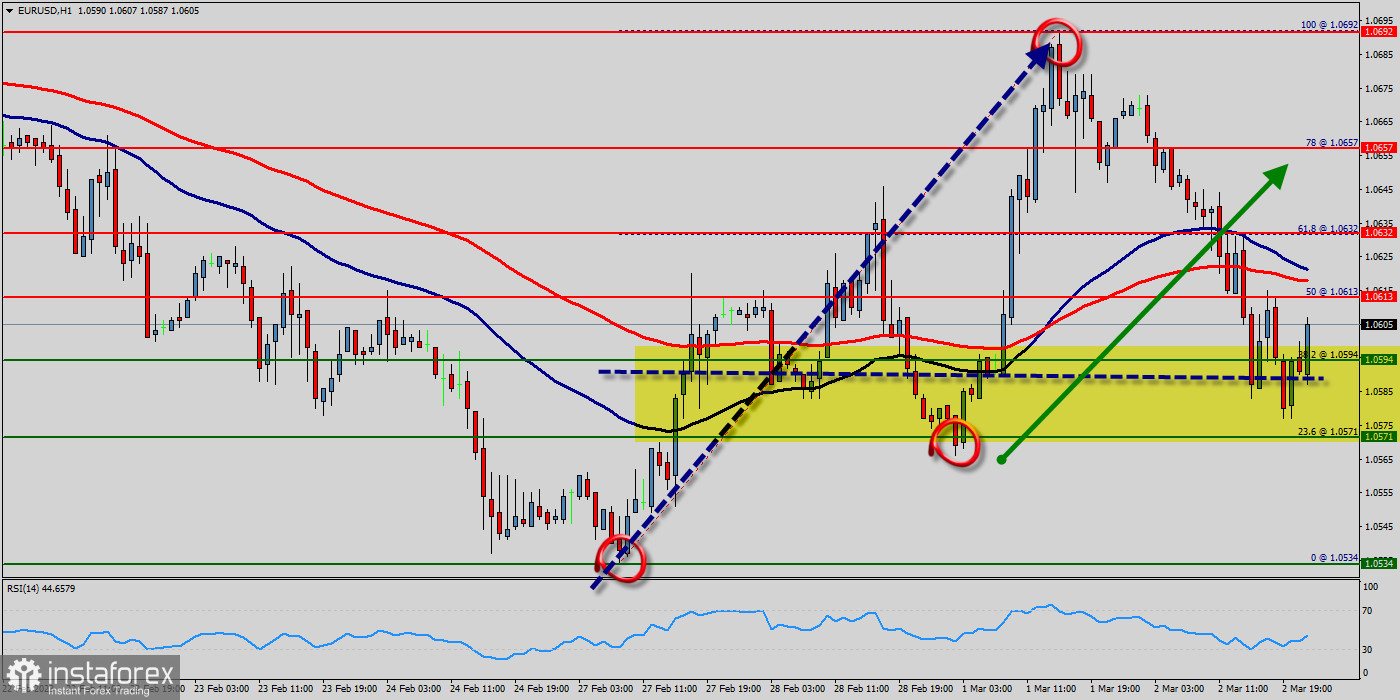
The trend of EUR/USD pair movement was controversial as it took place in a narrow sideways channel, the market showed signs of instability.
Amid the previous events, the price is still moving between the levels of 1.0632 and 1.0571.
Also, the daily resistance and support are seen at the levels of 1.0632 and 1.0571 respectively.
Therefore, it is recommended to be cautious while placing orders in this area. So, we need to wait until the sideways channel has completed.
The market moved from its bottom at 1.0571 and continued to rise towards the top of 1.0600.
Today, in the one-hour chart, the current rise will remain within a framework of correction.
The Relative Strength Index (RSI) is considered oversold because it is above 50. The RSI is still signaling that the trend is upward as it is still strong below the moving average (100). This suggests the pair will probably go down in coming hours. Accordingly, the market is likely to show signs of a bearish trend.
However, if the pair fails to pass through the level of 1.0613, the market will indicate a bearish opportunity below the strong resistance level of 1.0613 (the level of 1.0613 coincides with the double top too - 50% of Fibonacci retracement levels).
Since there is nothing new in this market, it is not bullish yet. Sell deals are recommended below the level of 1.0613 with the first target at 1.0571.
If the trend breaks the support level of 1.0571, the pair is likely to move downwards continuing the development of a bearish trend to the level 1.0534 in order to test the daily support 2 (horizontal green line).
*这里的市场分析是为了增加您对市场的了解,而不是给出交易的指示。
InstaSpot分析评论将让您充分了解市场趋势! 作为InstaSpot的客户,您将获得大量的免费服务以实现有效的交易。


