


我们的团队有超过700万的操盘手!
我们每天都在一起努力改善交易。我们得到了很高的成绩,并继续前进。
世界各地数以百万计的操盘手的认可是我们工作的最大赞赏! 您做出了您的选择,我们将尽一切努力来满足您的期望!
我们是一个共同的伟大团队!
InstaSpot. 自豪地为您工作!


UK retail sales data showed a slowdown in the decline from -5.7% to -4.7%. This is a positive factor, if not for the revision of the previous indicators for the worse from -4.9% to 5.7%, as well as the forecast of a stronger slowdown to -4.1%.
The bottom line shows bad statistics, which negatively affects the British currency.
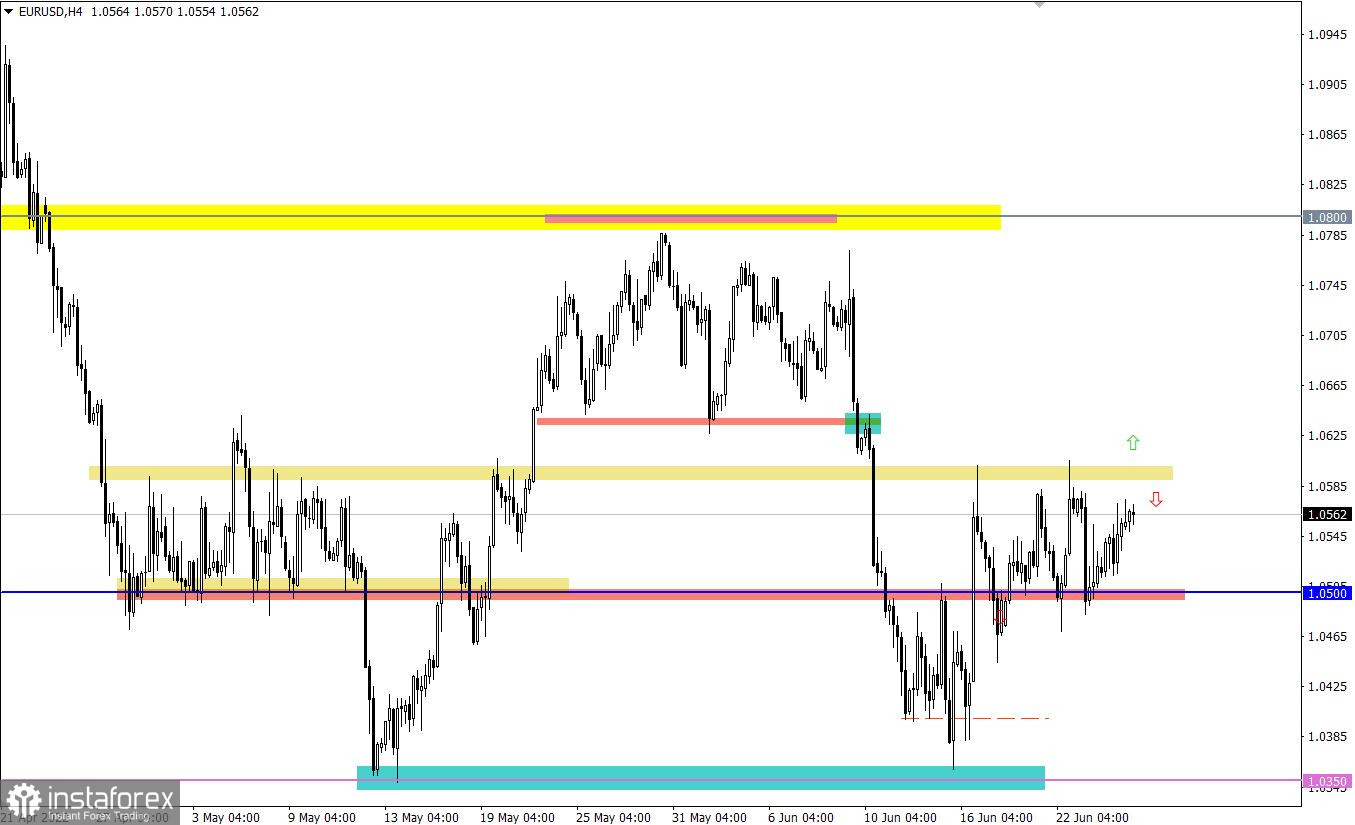
The EURUSD currency pair is moving within the range of 1.0500/1.0600, having local breaks, from time to time, that did not lead to violation of the set amplitude.
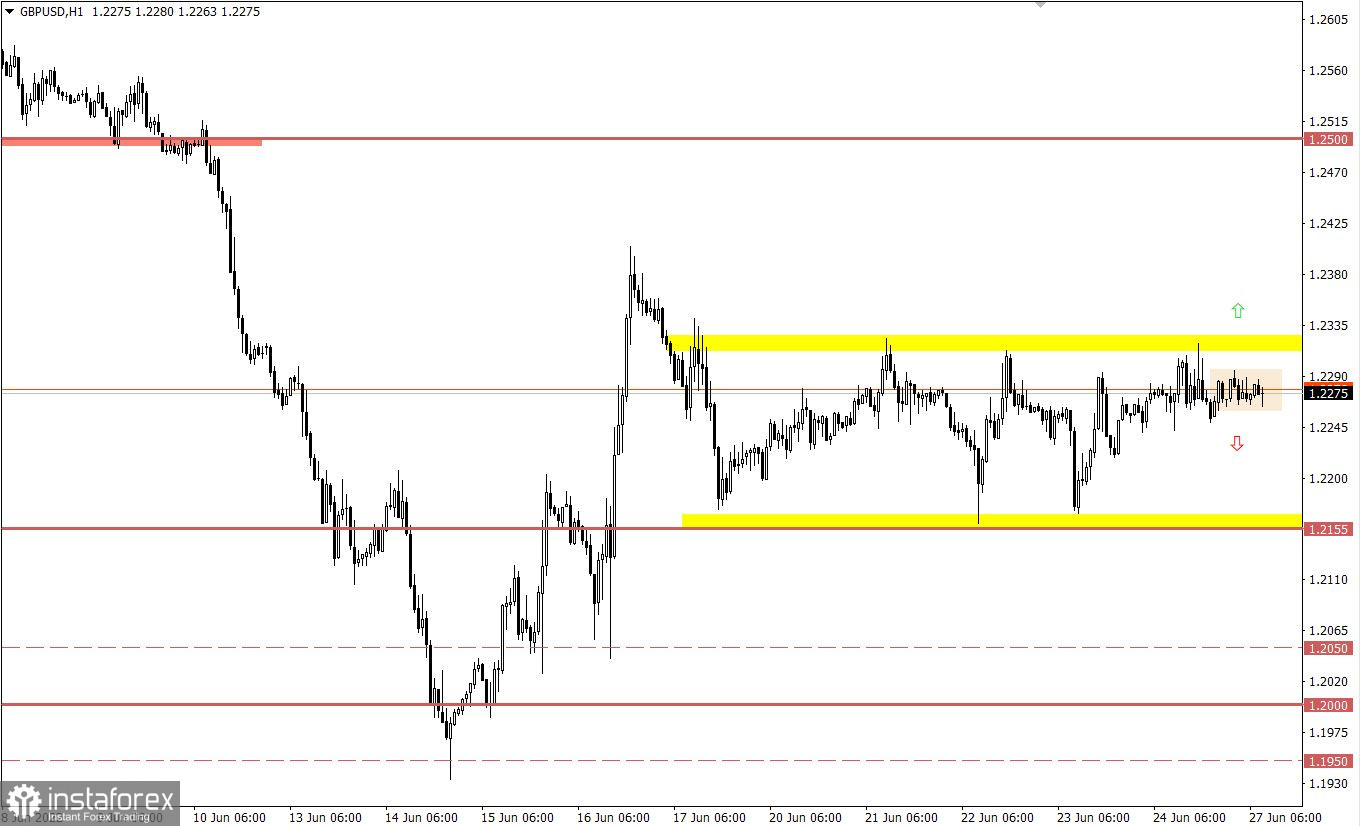
The GBPUSD currency pair has formed a stagnation within the stagnation. For the second week, the quote has been moving within the flat 1.2150/1.2320, where a stagnation was formed within its upper border. Price fluctuations in a closed corridor indicate a characteristic uncertainty among market participants, which can lead to the accumulation of trading forces.

Today, during the American trading session, data on orders for durable goods in the United States will be published, where May figures may decrease by 0.3%. If the data is confirmed, this is a negative factor, which can negatively affect the US dollar.
The flat is still relevant in the market, for this reason, traders are considering a scenario of a price rebound from the upper limit. If expectations coincide, the quote may slow down the growth rate, showing downward interest.
At the same time, market participants are considering a flat breakout scenario. An increase in the volume of long positions may occur when the price holds above the value of 1.0600 in a four-hour period.
In this situation, a short-term stagnation within the upper limit can become a lever in the subsequent acceleration in the market. Buy positions are taken into account after holding the price above the value of 1.2325 in a four-hour period. This step will indicate the completion of the flat. Sell positions should be considered after holding the price below 1.2250 in a four–hour period with the prospect of a move to 1.2200-1.2150.
A candlestick chart view is graphical rectangles of white and black light, with sticks on top and bottom. When analyzing each candle in detail, you will see its characteristics of a relative period: the opening price, closing price, and maximum and minimum prices.
Horizontal levels are price coordinates, relative to which a stop or a price reversal may occur. These levels are called support and resistance in the market.
Circles and rectangles are highlighted examples where the price of the story unfolded. This color selection indicates horizontal lines that may put pressure on the quote in the future.
The up/down arrows are the reference points of the possible price direction in the future.
*这里的市场分析是为了增加您对市场的了解,而不是给出交易的指示。
InstaSpot分析评论将让您充分了解市场趋势! 作为InstaSpot的客户,您将获得大量的免费服务以实现有效的交易。


