


The legend in the InstaSpot team!
Legend! You think that's bombastic rhetoric? But how should we call a man, who became the first Asian to win the junior world chess championship at 18 and who became the first Indian Grandmaster at 19? That was the start of a hard path to the World Champion title for Viswanathan Anand, the man who became a part of history of chess forever. Now one more legend in the InstaSpot team!


Borussia is one of the most titled football clubs in Germany, which has repeatedly proved to fans: the spirit of competition and leadership will certainly lead to success. Trade in the same way that sports professionals play the game: confidently and actively. Keep a "pass" from Borussia FC and be in the lead with InstaSpot!
Monday was traditionally accompanied by a blank macroeconomic calendar. Important statistics in Europe and the UK were not published. It was a holiday in the United States, which meant that banks, exchanges, funds, and companies were closed, which led to a decrease in trading volumes.
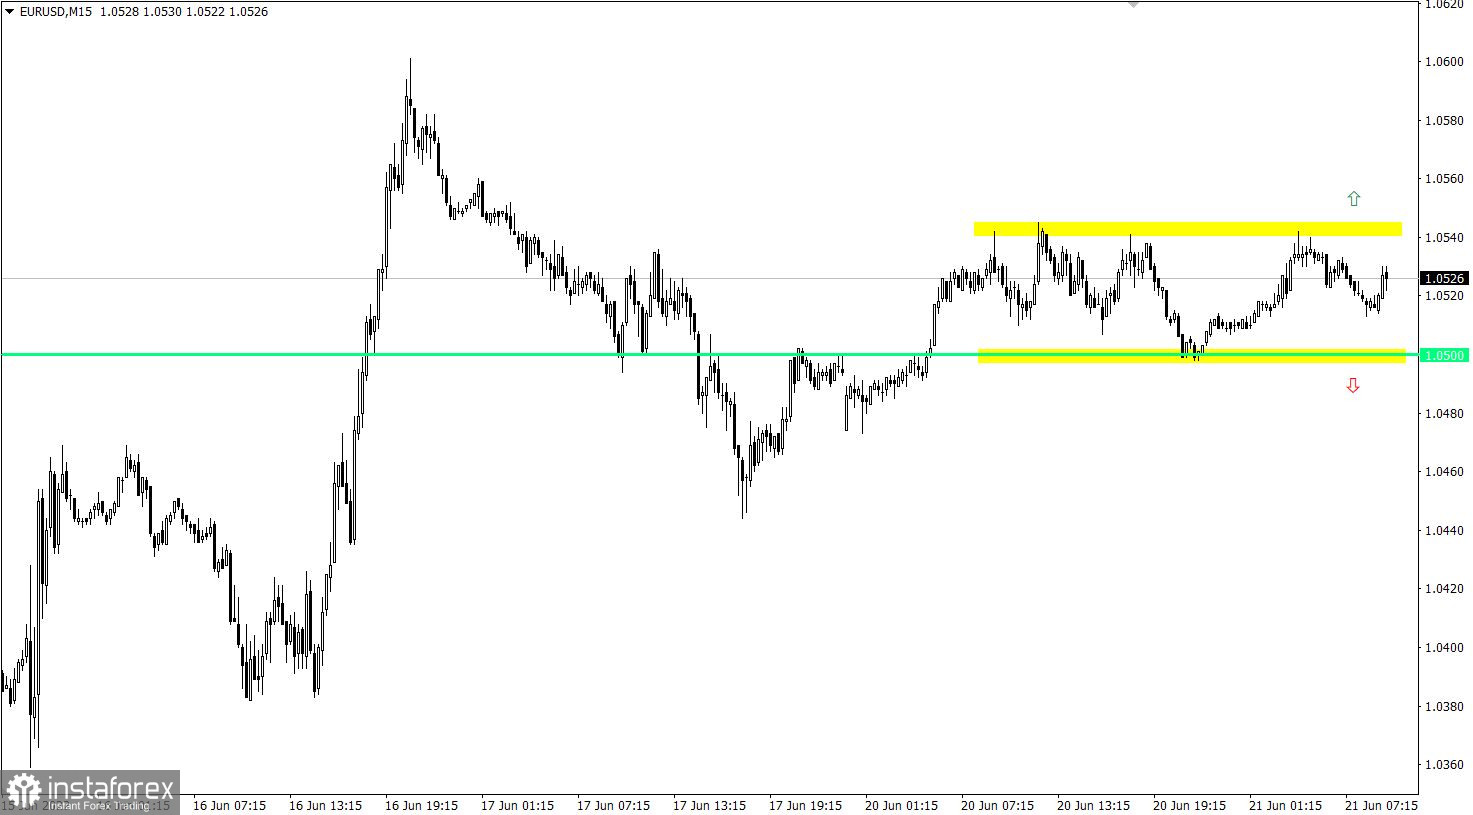
The EURUSD currency pair slowed down its downward course, which led to a pullback, and then to stagnation just above the mirror level of 1.0500. The amplitude move indicates a characteristic uncertainty in the subsequent movement, which may attract abundant attention from speculators.
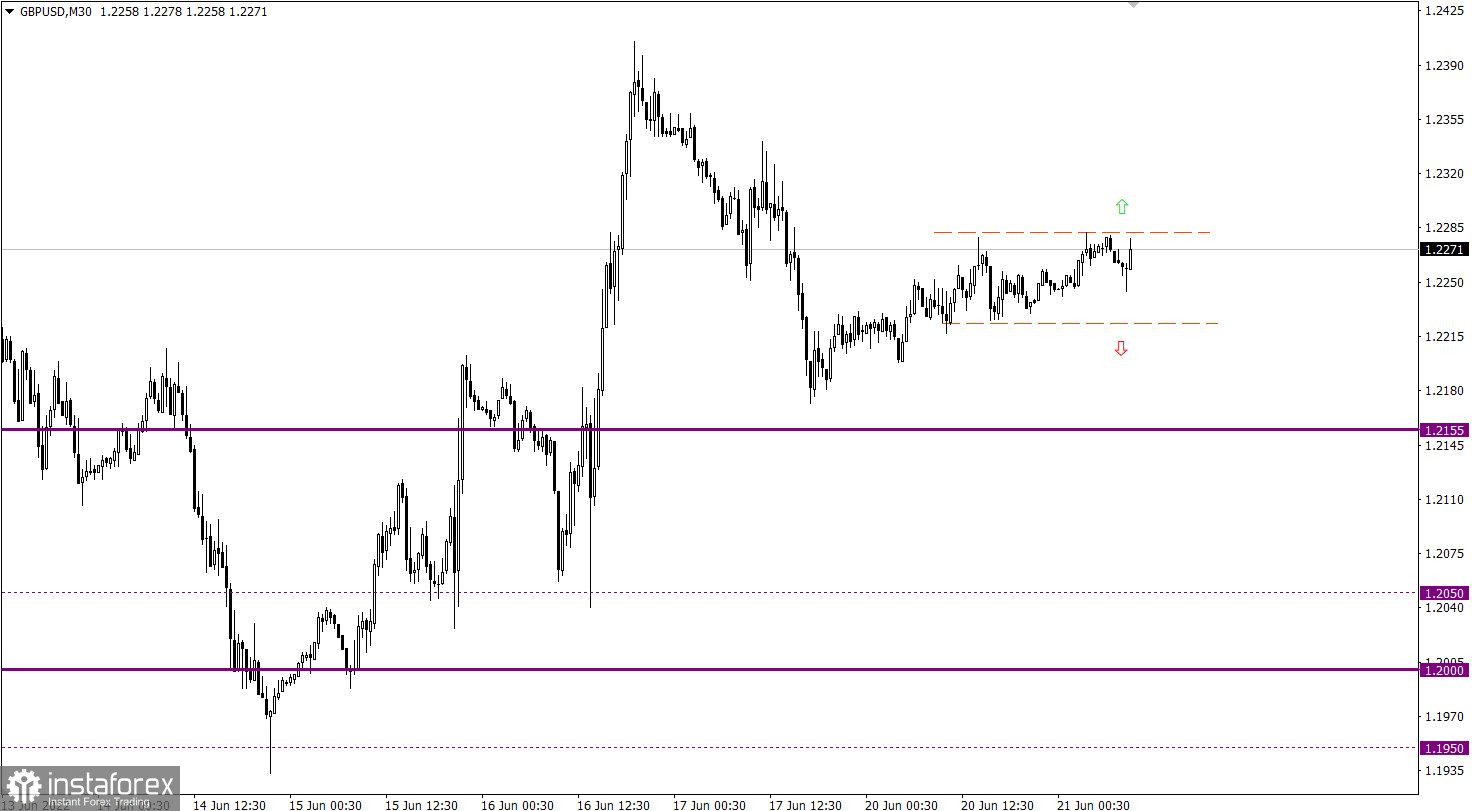
The GBPUSD currency pair found support in the area of 1.2155/1.2180 during an intensive decline. This led to a reduction in the volume of short positions and, as a result, a pullback.

Tuesday is not much different from Monday in terms of the macroeconomic calendar. Important statistics in Europe, the UK, and the United States are not expected. The only thing that can stimulate traders is the return to the financial markets of the United States after the weekend.
Based on the characteristic flat in the short term, traders will focus on the momentum coming from the range. The values of 1.0500 and 1.0545 serve as the boundaries of the variable amplitude.
We concretize the above into trading signals:
Buy positions on a currency pair are taken into account after holding the price above the value of 1.0550 in a four-hour period.
Sell positions should be considered after holding the price below 1.0495 in a four-hour period.
The pullback stage is more like stagnation, where activity is low, and the quote has a characteristic amplitude of 1.2225/1.2280. This movement can lead to a process of accumulation of trading forces, which will eventually provoke speculators to new jumps in the market. In this situation, buy positions will be considered by traders if the price is held above the value of 1.2290. This step will indicate a subsequent move in favor of restoring the British currency. Selling positions will be relevant if the price is kept below 1.2220, which will most likely lead to a move towards the support area of 1.2155/1.2180.
A candlestick chart view is graphical rectangles of white and black light, with sticks on top and bottom. When analyzing each candle in detail, you will see its characteristics of a relative period: the opening price, closing price, and maximum and minimum prices.
Horizontal levels are price coordinates, relative to which a stop or a price reversal may occur. These levels are called support and resistance in the market.
Circles and rectangles are highlighted examples where the price of the story unfolded. This color selection indicates horizontal lines that may put pressure on the quote in the future.
The up/down arrows are the reference points of the possible price direction in the future.
*这里的市场分析是为了增加您对市场的了解,而不是给出交易的指示。
InstaSpot分析评论将让您充分了解市场趋势! 作为InstaSpot的客户,您将获得大量的免费服务以实现有效的交易。


