


我们的团队有超过700万的操盘手!
我们每天都在一起努力改善交易。我们得到了很高的成绩,并继续前进。
世界各地数以百万计的操盘手的认可是我们工作的最大赞赏! 您做出了您的选择,我们将尽一切努力来满足您的期望!
我们是一个共同的伟大团队!
InstaSpot. 自豪地为您工作!


Details of the economic calendar from May 31
Inflation in the eurozone continues to update the record. The consumer price index continued to rise from 7.4% to 8.1% YoY. Inflation exceeds the ECB's target by more than four times. This gives us a clear signal that the regulator will raise the interest rate in the near future.
Negative inflation data put pressure on the European currency, which led to its weakening. It is worth considering that hints of an early increase in interest rates may lead to a backlash.
Analysis of trading charts from May 31
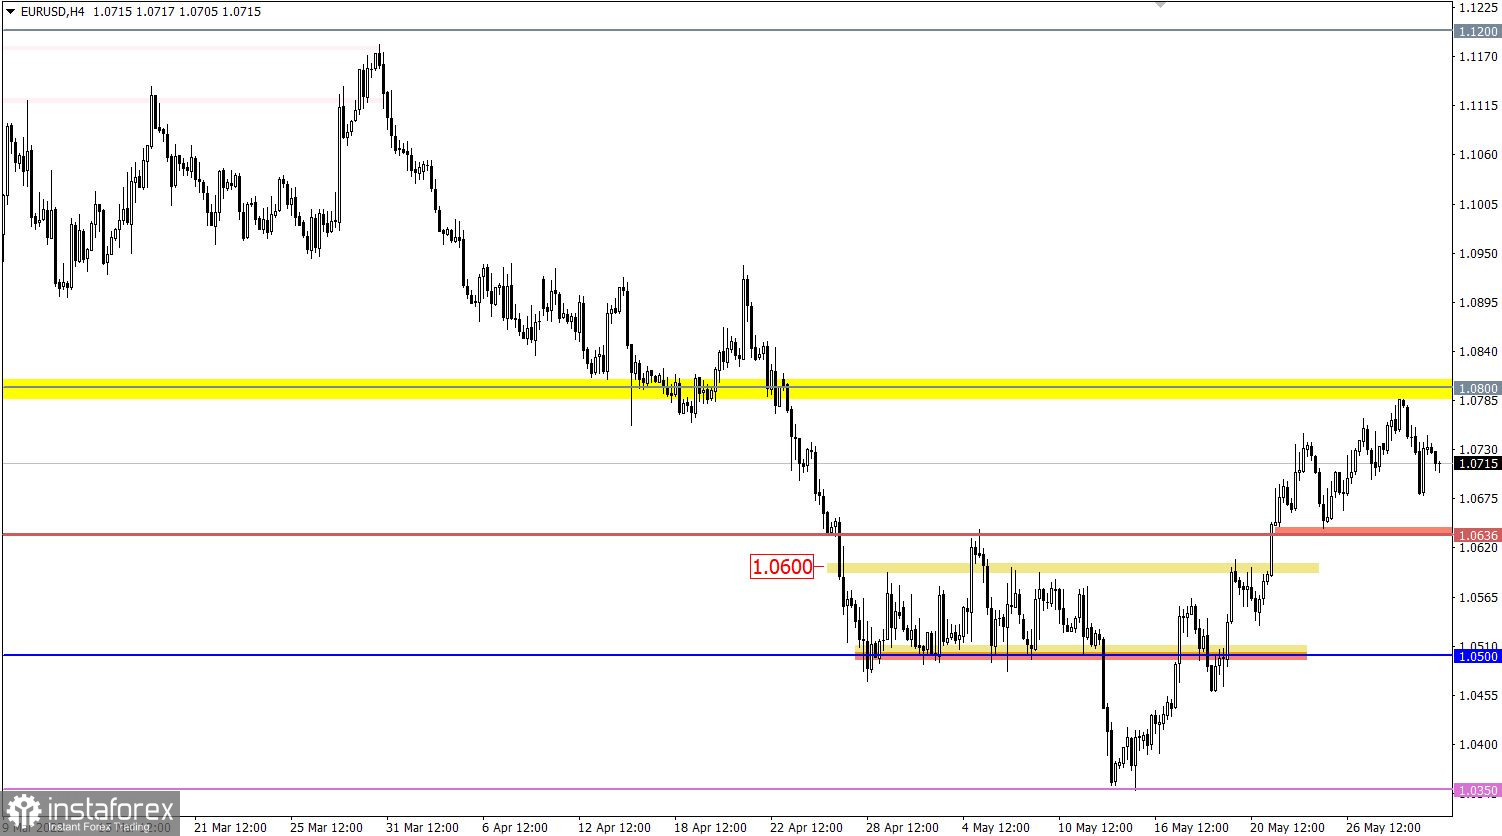
The EURUSD currency pair has slowed down the corrective move within the lower border of the resistance area of 1.0800/1.0850. This led to a reduction in the volume of long positions and, as a result, to a price rebound.
On the trading chart of the daily period, there is a corrective move from the pivot point of 1.0350, which fits into the clock component of the downward trend.
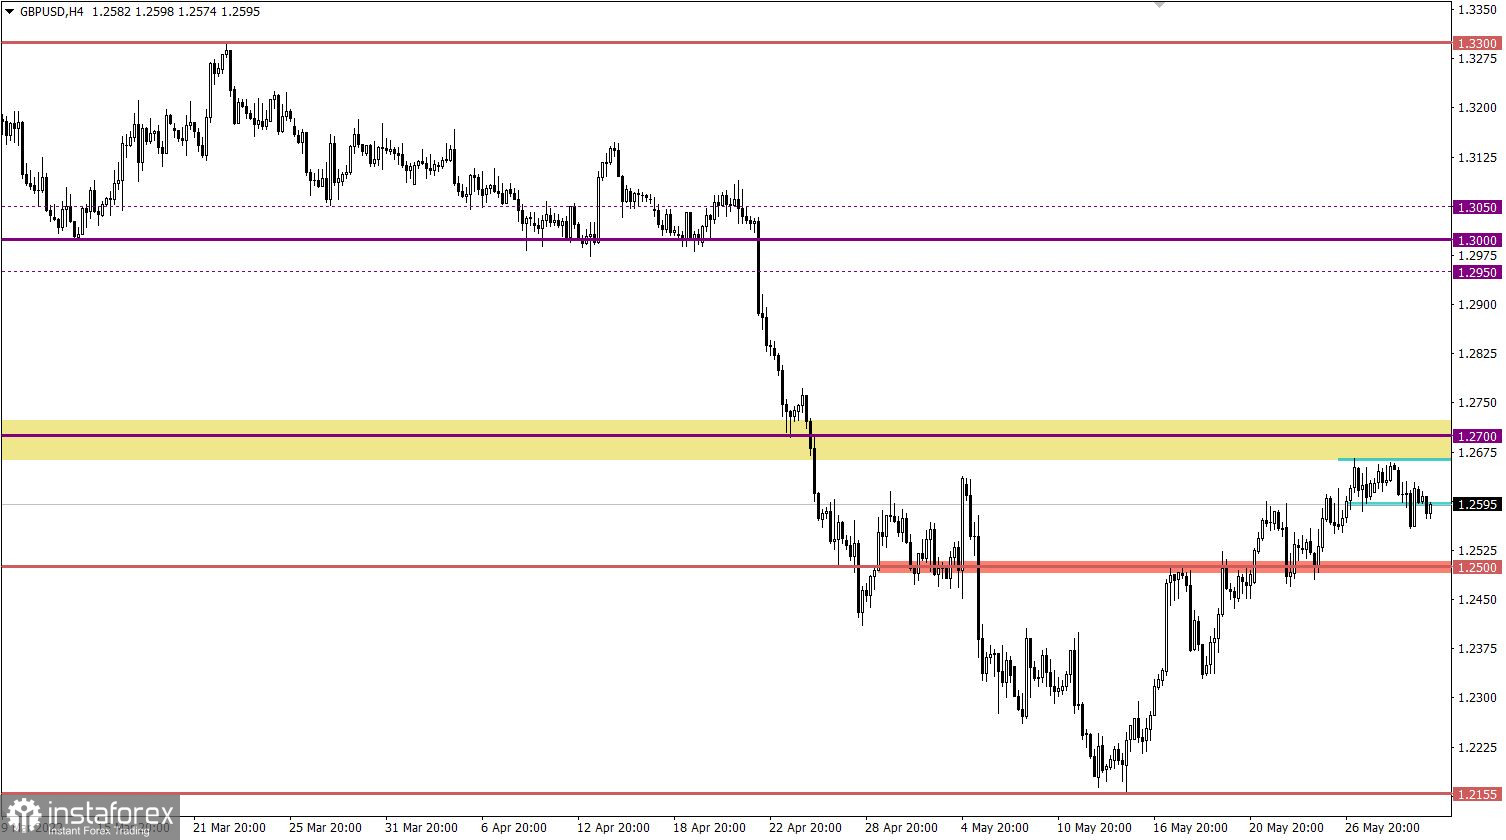
The GBPUSD currency pair changed from stagnation within 70 points to a downward move. This movement led to an increase in the volume of short positions, where the corrective move was in danger of being completed.
On the trading chart of the daily period, there is a corrective move from the pivot point of 1.2155, which fits into the clock component of the downward trend.

Economic calendar for June 1
The final data on the indices of business activity in the manufacturing sector in Europe, Britain, and the United States will be published today. According to forecasts, the indicators are expected to coincide with the preliminary assessment. Thus, there may not be a proper reaction to statistical data.
The most interesting indicator may be the data on the unemployment rate in Europe, where it is predicted to decrease from 6.8% to 6.7%. This is a positive factor for the EU economy, which may well support the euro exchange rate.
Time targeting
The index of business activity in the manufacturing sector in the EU - 08:00 UTC
The index of business activity in the manufacturing sector in Britain - 08:30 UTC
Unemployment rate in the EU - 11:00 UTC
The index of business activity in the manufacturing sector in the US - 14:00 UTC
Trading plan for EUR/USD on June 1
The process of restoring dollar positions is at an early stage. Traders are afraid of the resumption of the corrective course in case the price returns to the resistance area. The subsequent growth in the volume of short positions is expected during the period of price retention below the value of 1.0680. This move may lead to a stronger signal to sell the euro.
Trading plan for GBP/USD on June 1
Stable price retention below the value of 1.2560 will increase the chances of sellers in the subsequent recovery of dollar positions. In the future, this movement may restart the downward trend.
An alternative scenario of the market development will be considered by traders if the quote returns to the borders of the previously passed stagnation 1.2600/1.2670. In this case, a new signal about the prolongation of the corrective move may appear.
What is reflected in the trading charts?
A candlestick chart view is graphical rectangles of white and black light, with sticks on top and bottom. When analyzing each candle in detail, you will see its characteristics of a relative period: the opening price, closing price, and maximum and minimum prices.
Horizontal levels are price coordinates, relative to which a stop or a price reversal may occur. These levels are called support and resistance in the market.
Circles and rectangles are highlighted examples where the price of the story unfolded. This color selection indicates horizontal lines that may put pressure on the quote in the future.
The up/down arrows are the reference points of the possible price direction in the future.
*这里的市场分析是为了增加您对市场的了解,而不是给出交易的指示。
InstaSpot分析评论将让您充分了解市场趋势! 作为InstaSpot的客户,您将获得大量的免费服务以实现有效的交易。


