


The legend in the InstaSpot team!
Legend! You think that's bombastic rhetoric? But how should we call a man, who became the first Asian to win the junior world chess championship at 18 and who became the first Indian Grandmaster at 19? That was the start of a hard path to the World Champion title for Viswanathan Anand, the man who became a part of history of chess forever. Now one more legend in the InstaSpot team!


Borussia is one of the most titled football clubs in Germany, which has repeatedly proved to fans: the spirit of competition and leadership will certainly lead to success. Trade in the same way that sports professionals play the game: confidently and actively. Keep a "pass" from Borussia FC and be in the lead with InstaSpot!
Details of the economic calendar from May 13
EU industrial production data showed a decline of 0.8%, with a forecast of -1.0%. Despite a slight discrepancy in indicators, the European currency remained under pressure due to the fact that previous indicators were revised for the worse.
Analysis of trading charts from May 13
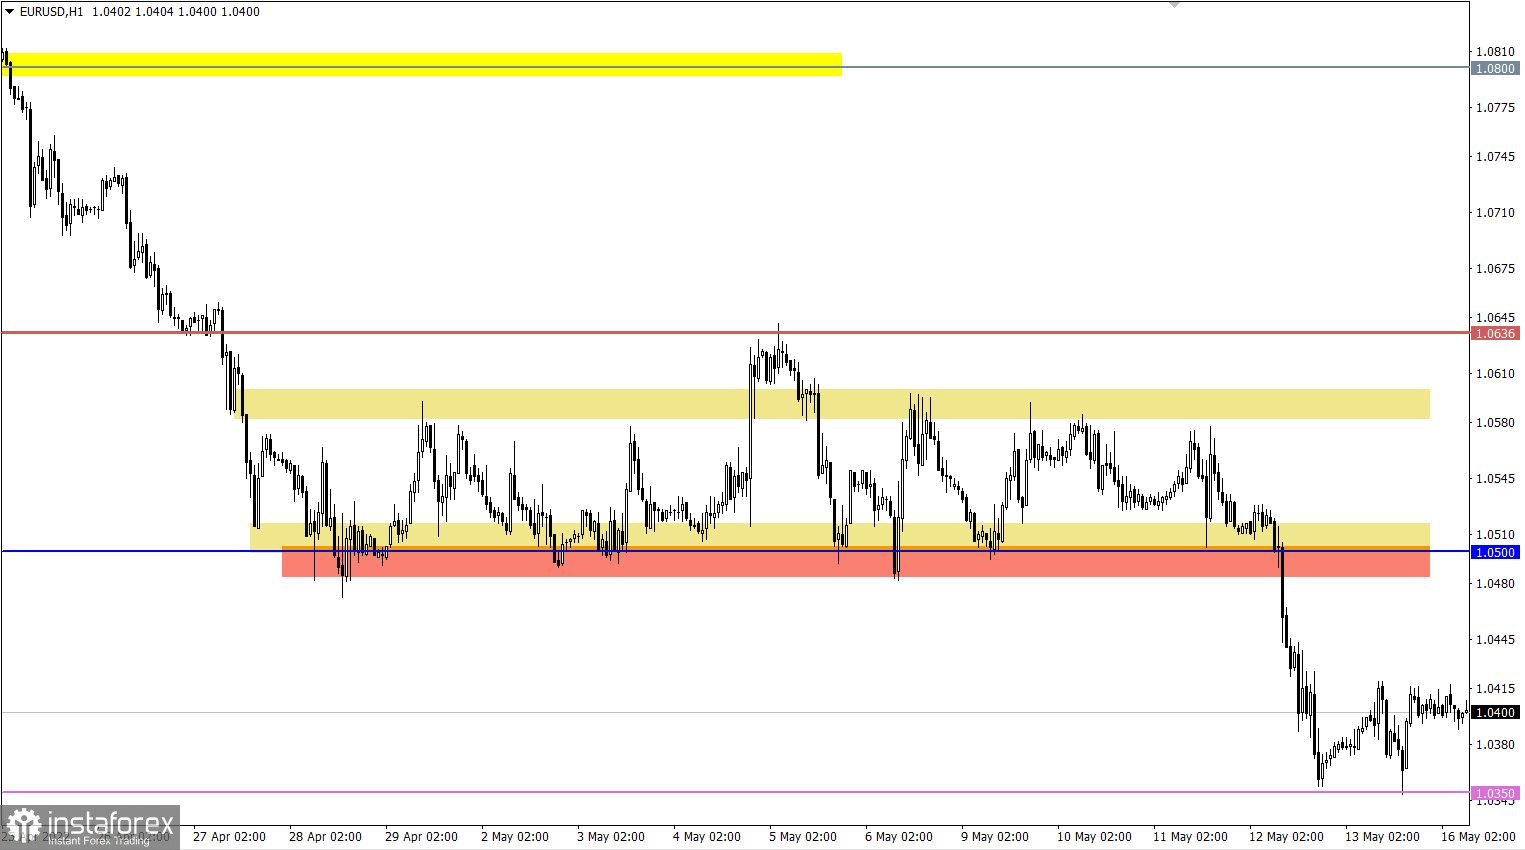
The EURUSD currency pair slowed down the downward move after the price approached the 2016 bottom. This led to a reduction in the volume of short positions and, as a result, a pullback of about 70 points.
On the trading chart of the daily period, there is an attempt to prolong the downward trend. In the future, this movement may lead to a breakdown of parity.
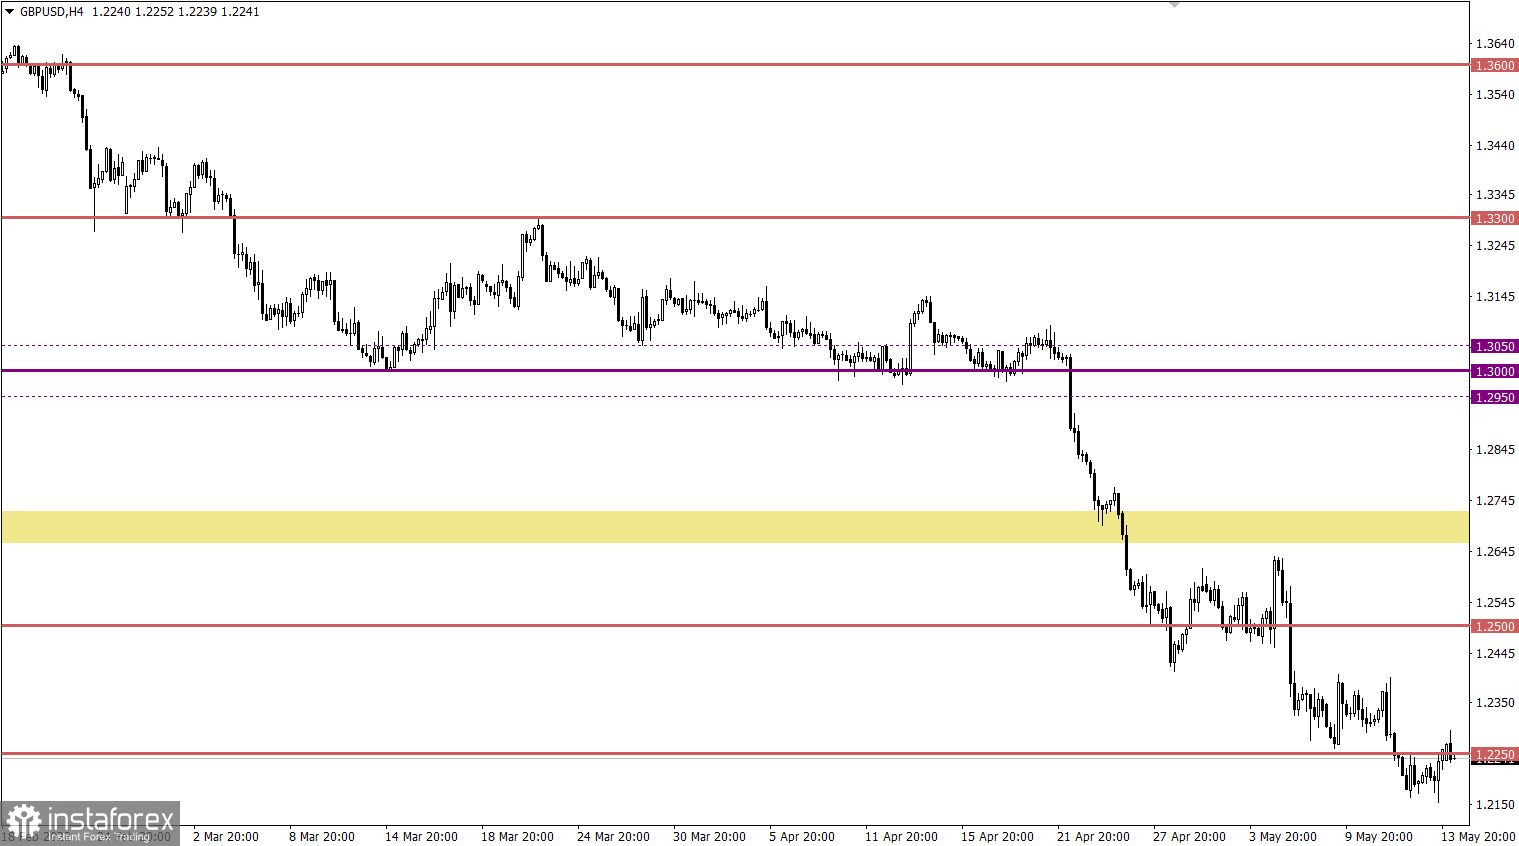
The GBPUSD currency pair, in the stage of a pullback from the variable pivot point of 1.2155, returned to the area of the level of 1.2250, where there was a slowdown. This step indicates the desire of sellers to resume the decline.
On the trading chart of the daily period, a gradual prolongation of the medium-term downward trend is observed.

Economic calendar for May 16
Monday is traditionally accompanied by a blank macroeconomic calendar. Nevertheless, stable information and news flow will continue to play on the nerves of speculators, which allows new jumps in the market.
Trading plan for EUR/USD on May 16
In this situation, the pullback was replaced by stagnation, where the values of 1.0350/1.0420 serve as variable boundaries of the amplitude. The optimal trading strategy is considered to be a breakdown of one or another stagnation border.
We concretize the above into trading signals:
Buy positions on the currency pair are taken into account after holding the price above the value of 1.0450 with the prospect of a move to 1.0500.
Sell positions should be considered after keeping the price below the local low of 2016, at 1.0325.
Trading plan for GBP/USD on May 16
Despite the slowdown, the pullback stage is still relevant in the market. In order for the downward cycle to resume, the quote must first return to the pivot point of 1.2150. This price move will indicate an increase in the volume of short positions, which will lead to the breakdown of the variable support and the trend prolongation.
An alternative market development scenario considers the price transition from the pullback stage to a full-scale correction. This movement can be indicated by a long stay of the price above 1.2250 in the daily period.
What is reflected in the trading charts?
A candlestick chart view is graphical rectangles of white and black light, with sticks on top and bottom. When analyzing each candle in detail, you will see its characteristics of a relative period: the opening price, closing price, and maximum and minimum prices.
Horizontal levels are price coordinates, relative to which a stop or a price reversal may occur. These levels are called support and resistance in the market.
Circles and rectangles are highlighted examples where the price of the story unfolded. This color selection indicates horizontal lines that may put pressure on the quote in the future.
The up/down arrows are the reference points of the possible price direction in the future.
*这里的市场分析是为了增加您对市场的了解,而不是给出交易的指示。
InstaSpot分析评论将让您充分了解市场趋势! 作为InstaSpot的客户,您将获得大量的免费服务以实现有效的交易。


