


我们的团队有超过700万的操盘手!
我们每天都在一起努力改善交易。我们得到了很高的成绩,并继续前进。
世界各地数以百万计的操盘手的认可是我们工作的最大赞赏! 您做出了您的选择,我们将尽一切努力来满足您的期望!
我们是一个共同的伟大团队!
InstaSpot. 自豪地为您工作!


The macroeconomic calendar was empty, and important statistics on Europe, Great Britain and the United States were not published. There were speeches by a number of Fed representatives, but nothing new was heard from their speech.
The market largely continued to stand still.
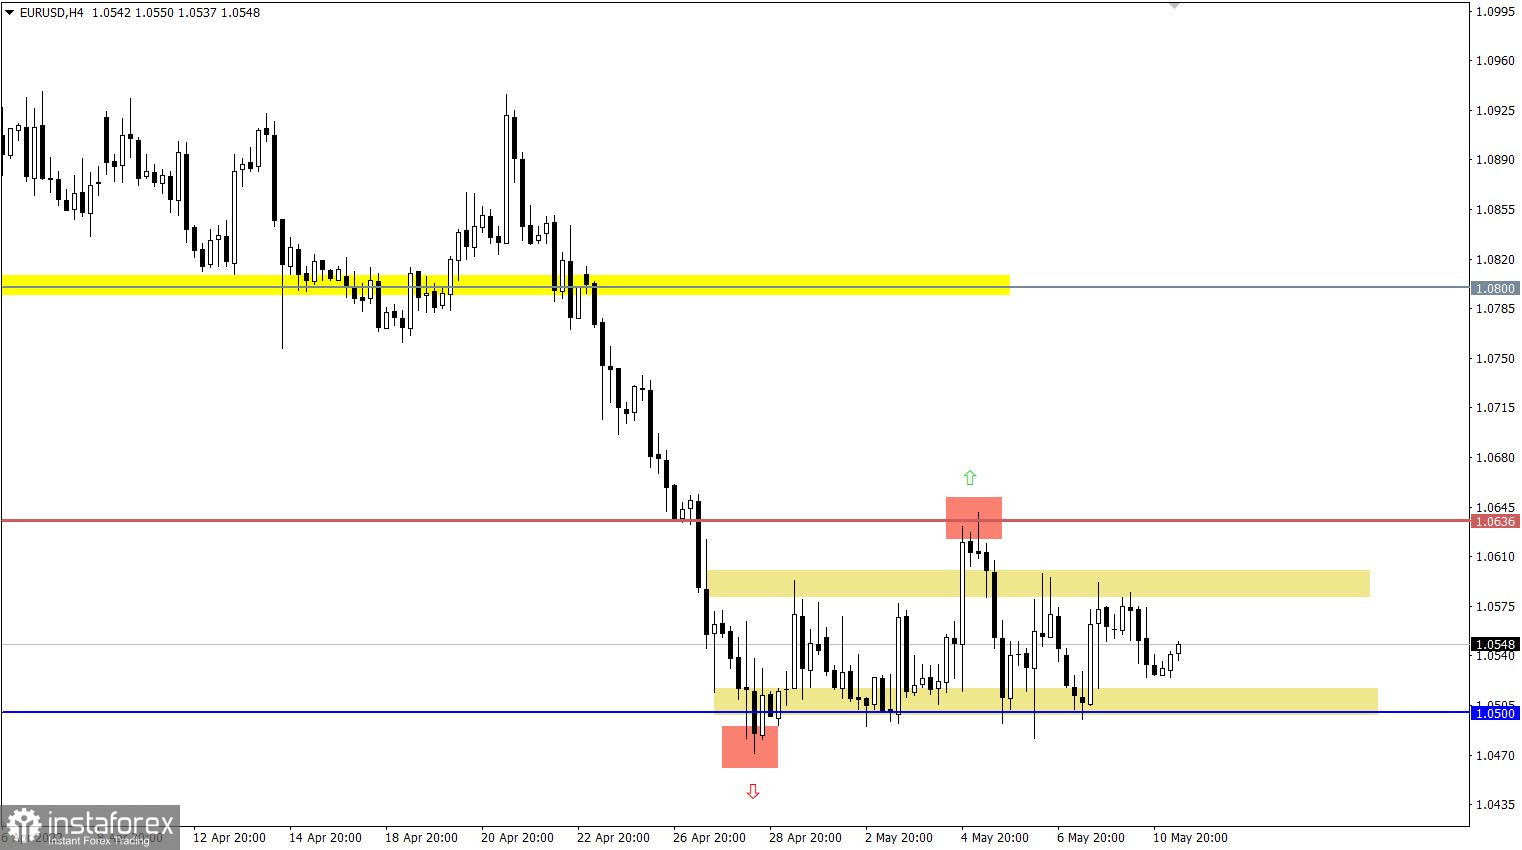
The EURUSD currency pair has been moving in the 1.0500/1.0600 side channel for the second week in a row, periodically breaking through the given boundaries. A long-term price movement in a closed amplitude signals a characteristic uncertainty among traders. This movement may lead to new speculative surges in the market.
The GBPUSD currency pair slowed down its downward movement after the price approached the support level of 1.2250. This led to a local price rebound followed by stagnation.

US inflation data is expected to be published. The consumer price index is expected to decline for the first time since the summer of 2021. This is a positive signal for the US economy, and will also indicate confirmation of the Fed's action in tightening monetary policy.
How will this news play on the market?
In the beginning, it can play on the dollar exchange rate in terms of its local strengthening. After that, the US dollar may come under pressure if the Fed softens the requirements for tightening monetary policy. In simple words, the Fed's subsequent comments with the gradual normalization of inflation may already be more restrained. From the rhetoric, the statement about the interest rate hike by 0.75% will disappear at first. After that, they can lower the bar for a one-time increase from 0.5% to 0.25%. In this case, the above text is just a reflection of possible scenarios for reducing inflation. The prospect is medium-term.
Time targeting
US inflation - 12:30 UTC (prev. 8.5% ---> forecast 8.1%)
The stagnation stage will end soon, the existing amplitude in the values of 1.0500/1.0600 will play the role of a lever for speculators. In this case, the optimal trading strategy is considered to be a breakdown of one or another stagnation border.
We concretize the above into trading signals:
Buy positions on the currency pair are taken into account after holding the price above the value of 1.0636 in a four-hour period.
Sell positions should be considered after holding the price below 1.0470 in a four-hour period due to the repeated storming of the 1.0500 border.
Price movement within the framework of stagnation is a local manifestation of the market. In this situation, the key values are considered to be: 1.2250 (support level) and the peak of the recent eye at 1.2405. Holding the price outside one or another control value may well indicate a subsequent quote path.
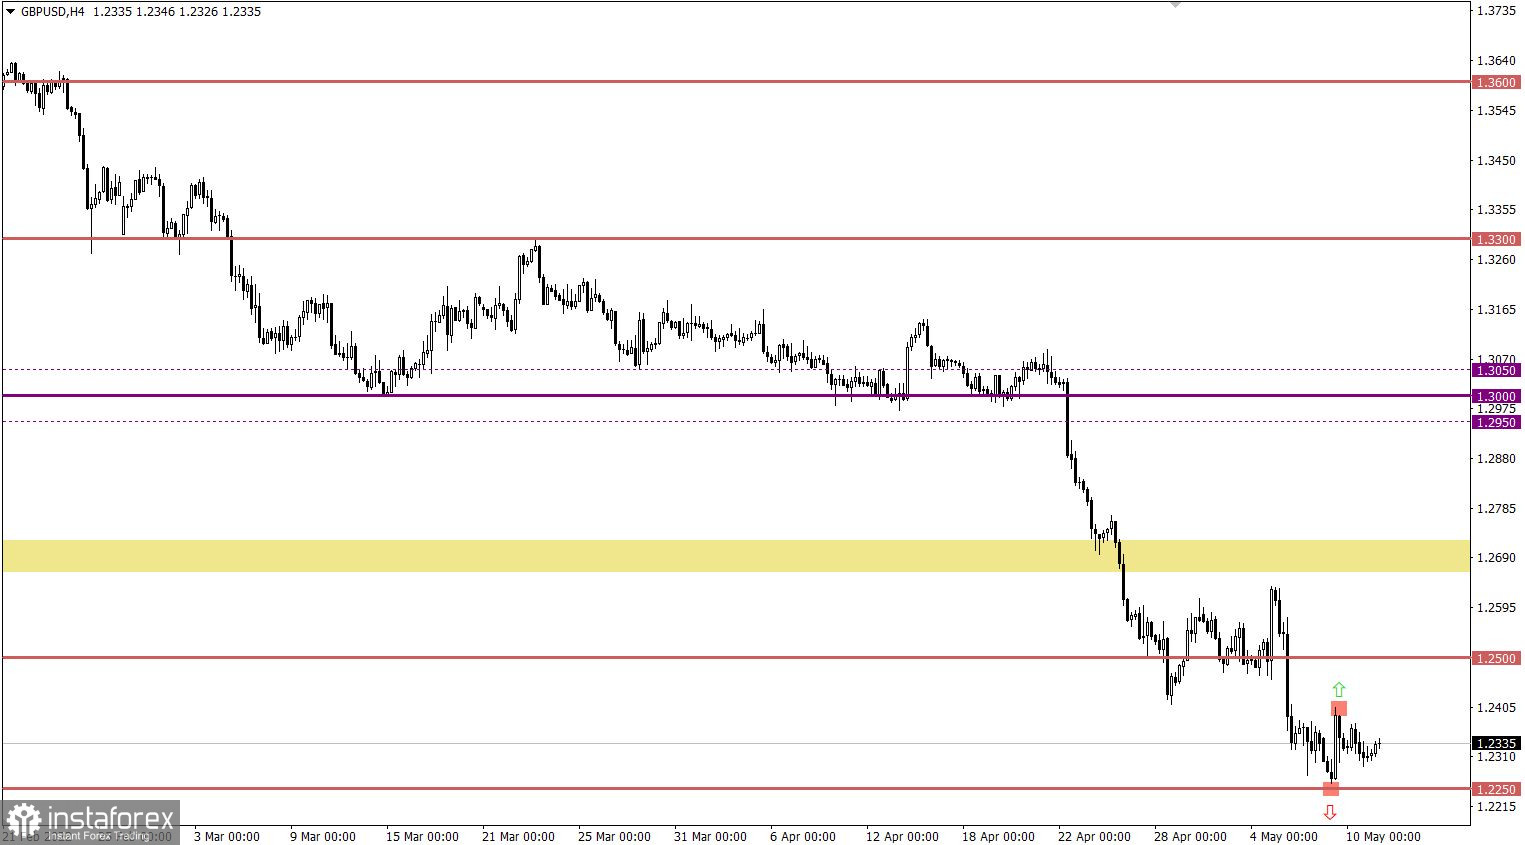
A candlestick chart view is graphical rectangles of white and black light, with sticks on top and bottom. When analyzing each candle in detail, you will see its characteristics of a relative period: the opening price, closing price, and maximum and minimum prices.
Horizontal levels are price coordinates, relative to which a stop or a price reversal may occur. These levels are called support and resistance in the market.
Circles and rectangles are highlighted examples where the price of the story unfolded. This color selection indicates horizontal lines that may put pressure on the quote in the future.
The up/down arrows are the reference points of the possible price direction in the future.
*这里的市场分析是为了增加您对市场的了解,而不是给出交易的指示。
InstaSpot分析评论将让您充分了解市场趋势! 作为InstaSpot的客户,您将获得大量的免费服务以实现有效的交易。


