


The legend in the InstaSpot team!
Legend! You think that's bombastic rhetoric? But how should we call a man, who became the first Asian to win the junior world chess championship at 18 and who became the first Indian Grandmaster at 19? That was the start of a hard path to the World Champion title for Viswanathan Anand, the man who became a part of history of chess forever. Now one more legend in the InstaSpot team!


Borussia is one of the most titled football clubs in Germany, which has repeatedly proved to fans: the spirit of competition and leadership will certainly lead to success. Trade in the same way that sports professionals play the game: confidently and actively. Keep a "pass" from Borussia FC and be in the lead with InstaSpot!
Last week ended with a day off in Europe, Britain, the United States, Switzerland, Canada, Australia, and New Zealand due to the celebration of Good Friday. This led to a reduction in trading volumes and low volatility in the market.
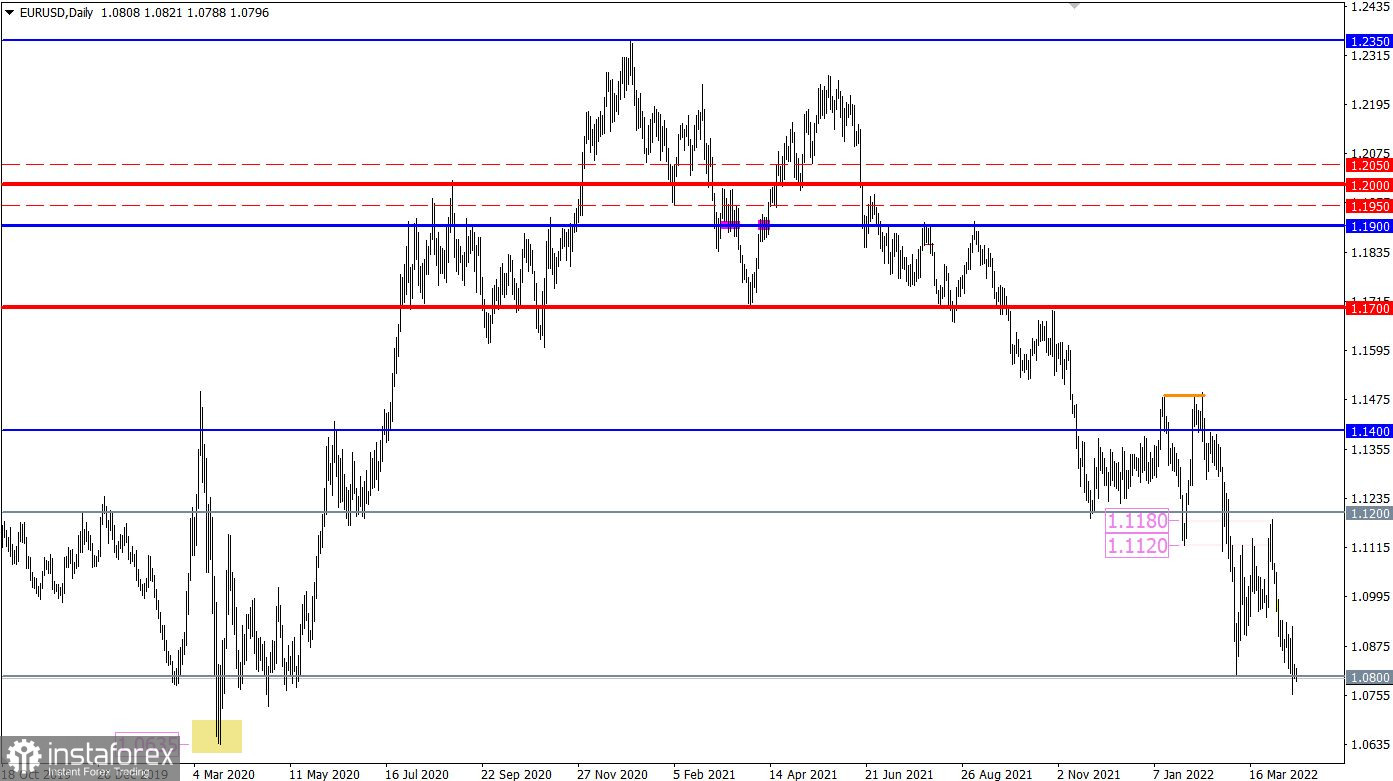
The EURUSD currency pair ended its stagnation within the support level of 1.0800 with its breakdown along a downward trajectory. This was a signal of prolongation of the medium-term downward trend.
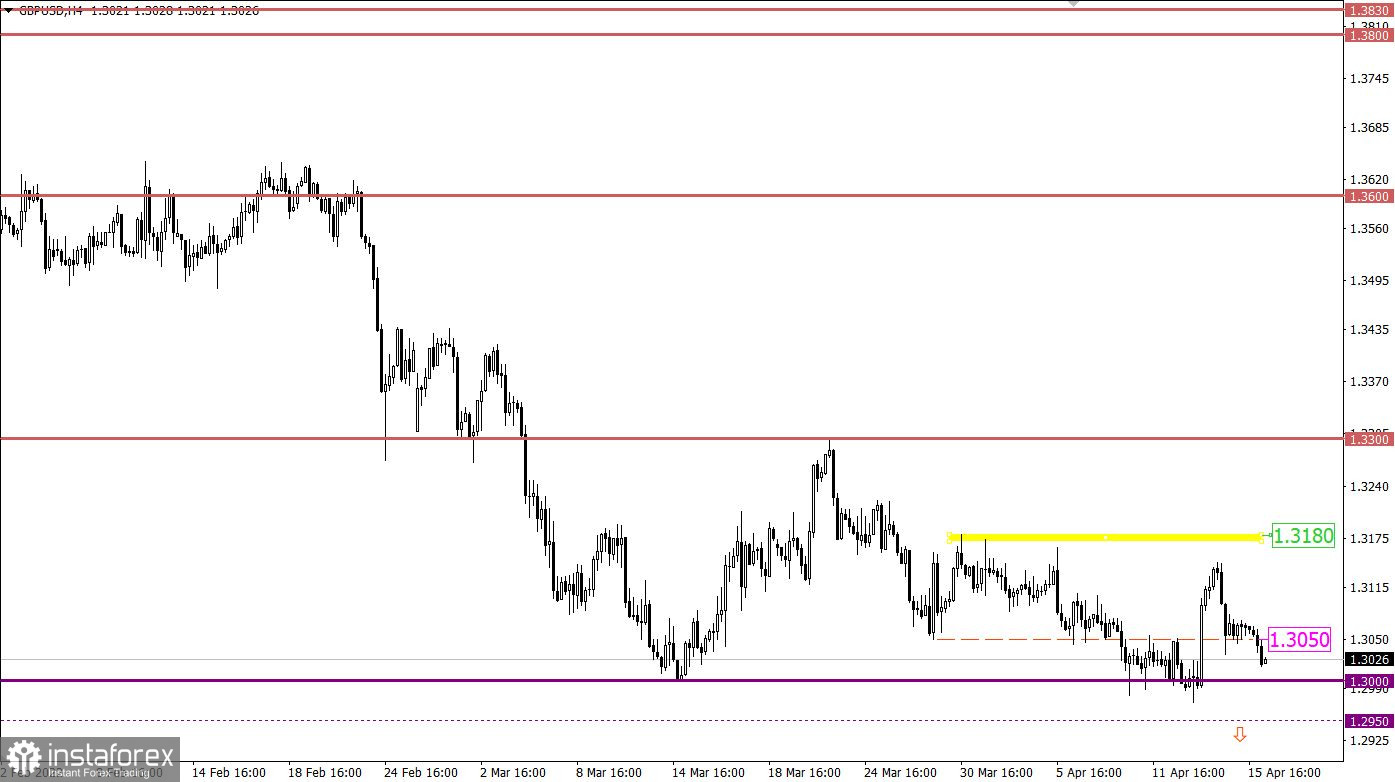
The GBPUSD currency pair, after a short stop near the value of 1.3050, rushed down towards the main support point of 1.3000. This indicates the prevailing downward interest among traders, where the medium-term trend will eventually be extended to new price levels.

Today is a day off in Europe due to the celebration of Easter, so the financial sectors are not working. Thus, trading volumes may be reduced again, which will negatively affect volatility.
Stable price retention below the support level of 1.0800 in a four-hour period increases the chances of sellers for a subsequent downward move. Traders consider the area of the local lows of 2020 at 1.0635/1.0660 as possible targets.
At the time of writing, the quote is already moving within the psychological level of 1.3000, which indicates a complete recovery of short positions relative to the recent correction. The main signal to sell the pound sterling will come from the market when the price is kept below the value of 1.2950. In this case, the medium-term downward trend will be prolonged.
An alternative scenario of market development considers a local slowdown within the level of 1.3000, while the general downward mood will remain in the market. This step will only temporarily slow down sellers.
A candlestick chart view is graphical rectangles of white and black light, with sticks on top and bottom. When analyzing each candle in detail, you will see its characteristics of a relative period: the opening price, closing price, and maximum and minimum prices.
Horizontal levels are price coordinates, relative to which a stop or a price reversal may occur. These levels are called support and resistance in the market.
Circles and rectangles are highlighted examples where the price of the story unfolded. This color selection indicates horizontal lines that may put pressure on the quote in the future.
The up/down arrows are the reference points of the possible price direction in the future.
*这里的市场分析是为了增加您对市场的了解,而不是给出交易的指示。
InstaSpot分析评论将让您充分了解市场趋势! 作为InstaSpot的客户,您将获得大量的免费服务以实现有效的交易。


