


我们的团队有超过700万的操盘手!
我们每天都在一起努力改善交易。我们得到了很高的成绩,并继续前进。
世界各地数以百万计的操盘手的认可是我们工作的最大赞赏! 您做出了您的选择,我们将尽一切努力来满足您的期望!
我们是一个共同的伟大团队!
InstaSpot. 自豪地为您工作!


Let's recall some details from the economic calendar on April 13. Analysts are alarmed by incredible consumer inflation rates in the UK. The annual UK CPI skyrocketed to 7.0% in March from 6.2% a month ago. The latest figure is the strongest one since March 1992.
Analysts are alarmed by incredible consumer inflation rates in the UK. The annual UK CPI skyrocketed to 7.0% in March from 6.2% a month ago. The latest figure is the strongest one since March 1992.
Such appalling inflation rates make a dent in the national economic output. In turn, this is bearish for the pound sterling.
During the American trading hours, traders got to know factory inflation in the US. The US PPI rose to 11.2% in March from 10.3% in February. Accelerating factory inflation will certainly push consumer prices higher. By the way, consumer inflation has already conquered historic peaks. Thus, soaring inflation casts a shadow over the US economy.
Overview of technical charts from April 13
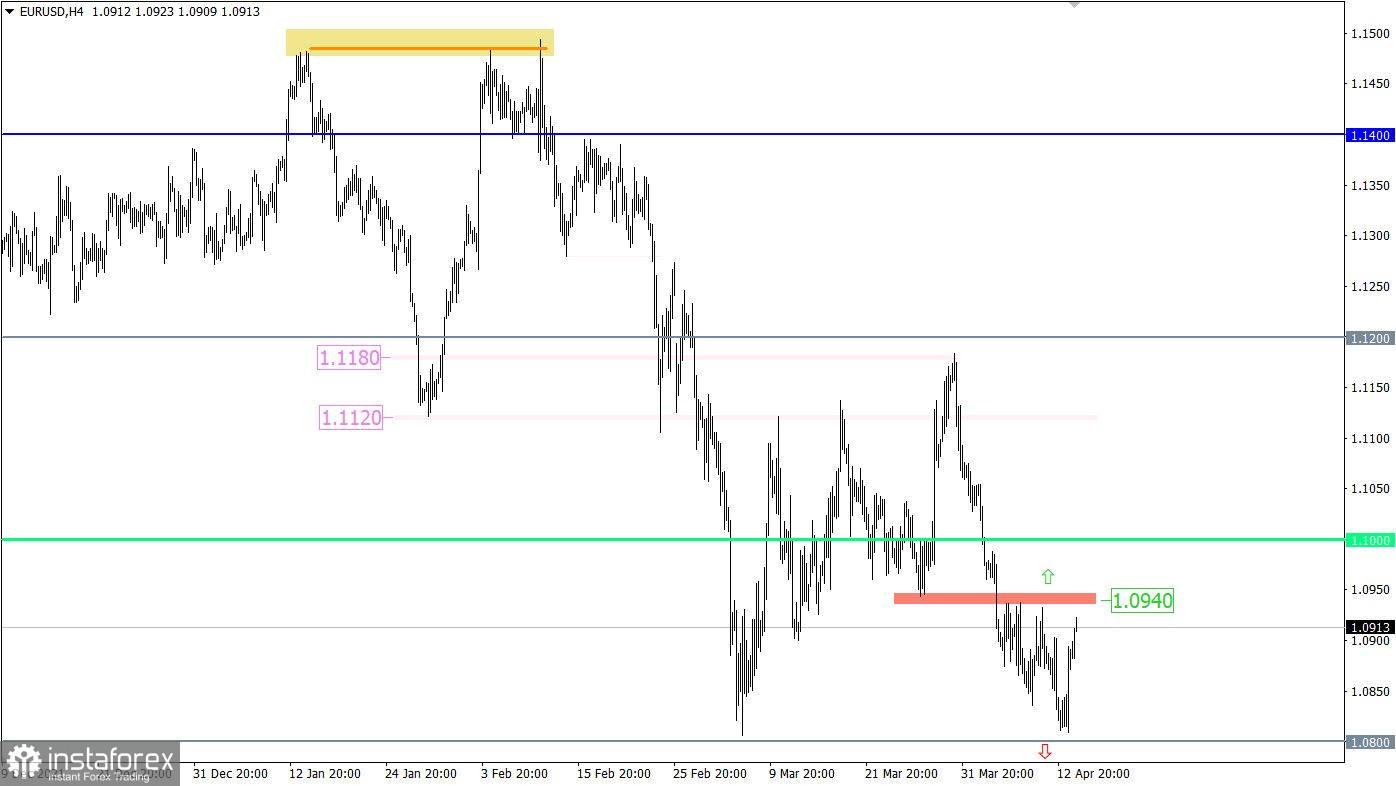
After EUR/USD approached support at 1.0800, traders sharply cut on short positions. As a result, the currency pair got stuck in a trading range and then rebounded by 100 pips. Comparative analysis of the two trading instruments, EUR/USD and GBP/USD, revealed positive correlation. A sharp increase in the pound sterling might have boosted robust demand for the euro.
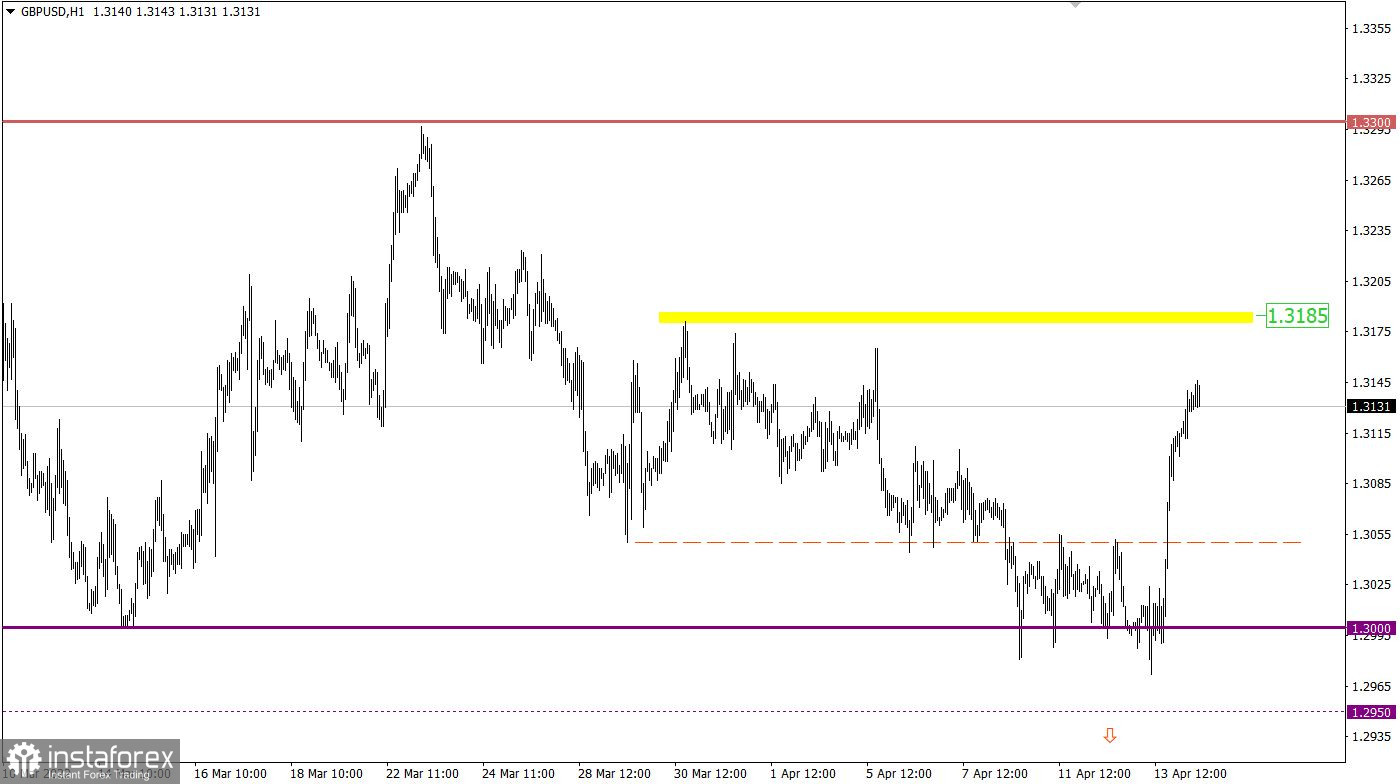
GBP/USD had been locked inside the trading range for three weeks. Eventually, the pair escaped from the range of 1.2980/1.3050, breaking the upper border. The price action occurred due to the speculative interest. The price rebounded off the psychologically important level at 1.3000. The bulls won a victory in the struggle with the bears.
Economic calendar on April 14, 2022
Today the ECB policy meeting is on investors' radars. The odds are that the ECB will maintain its repo rate at the previous level of 0.00%. However, investors hope that the regulator will take some measures against runaway inflation. So, traders will be looking for clues to rate hikes in the visible future. Besides, the ECB is expected to fasten a pace of withdrawing the QE program. Such policy decisions would prop up the euro. However, if the ECB policymakers stand pat on monetary policy and evade hints on further tightening, the euro will extend its weakness.
During the New York trade today, the US is due to report on retail sales which are projected to decrease to 11.0% in March from 17.6% in February. As usual on Thursday, traders monitor weekly updates on US unemployment claims. The number of initial jobless claims could have edged down last week. Notably, the publication of the US data coincides with the ECB press conference. Thus, the market might neglect the macroeconomic data.
Forecasts of US economic data
Initial unemployment claims could have risen to 171K last week from 166K a week ago.
Continuing unemployment claims could have contracted to 1.5 million from 1.523 million.
Schedule
ECB policy statement – 11.45 GMT
ECB press conference – 12.30 GMT
US retail sales – 12.30 GMT
US unemployment claims – 12.50 GMT
Under such market conditions, a lot will depend on the information background, in particular the ECB policy decisions. Speaking about technical levels, the buyers have to deal with the interim level of 1.0940 that could serve as resistance if the buyers decide to scale back long positions. In case the price settles above 1.0950, the upward correction is likely to continue towards 1.1000.
Speculative operations seem to be overheated because of such sharp price swings. So, market sentiment is going to change. The level of 1.3180 acts as interim resistance where traders might decide to cut on long positions. This could slow down the upward cycle. As a result, the price might proceed with a downward trajectory.
A candlestick chart view is graphical rectangles of white and black light, with sticks on top and bottom. When analyzing each candle in detail, you will see its characteristics of a relative period: the opening price, closing price, and maximum and minimum prices.
Horizontal levels are price coordinates, relative to which a stop or a price reversal may occur. These levels are called support and resistance in the market.
Circles and rectangles are highlighted examples where the price of the story unfolded. This color selection indicates horizontal lines that may put pressure on the quote in the future.
The up/down arrows are the reference points of the possible price direction in the future.
*这里的市场分析是为了增加您对市场的了解,而不是给出交易的指示。
InstaSpot分析评论将让您充分了解市场趋势! 作为InstaSpot的客户,您将获得大量的免费服务以实现有效的交易。


