


我们的团队有超过700万的操盘手!
我们每天都在一起努力改善交易。我们得到了很高的成绩,并继续前进。
世界各地数以百万计的操盘手的认可是我们工作的最大赞赏! 您做出了您的选择,我们将尽一切努力来满足您的期望!
我们是一个共同的伟大团队!
InstaSpot. 自豪地为您工作!


The ADP report showed that jobs in the private sector in the United States increased in March by 455,000. The forecast was 450,000. February data, according to the revision, amounted to 486,000.
Meanwhile, the final data on U.S. GDP in the fourth quarter of 2021 totaled 6.9%, with expectations of 7.1%.
At the time of the publication of the statistics, the U.S. dollar stood still, even though ADP performance is by no means bad. About an hour after the publication, the U.S. dollar decreased in value against competitors.
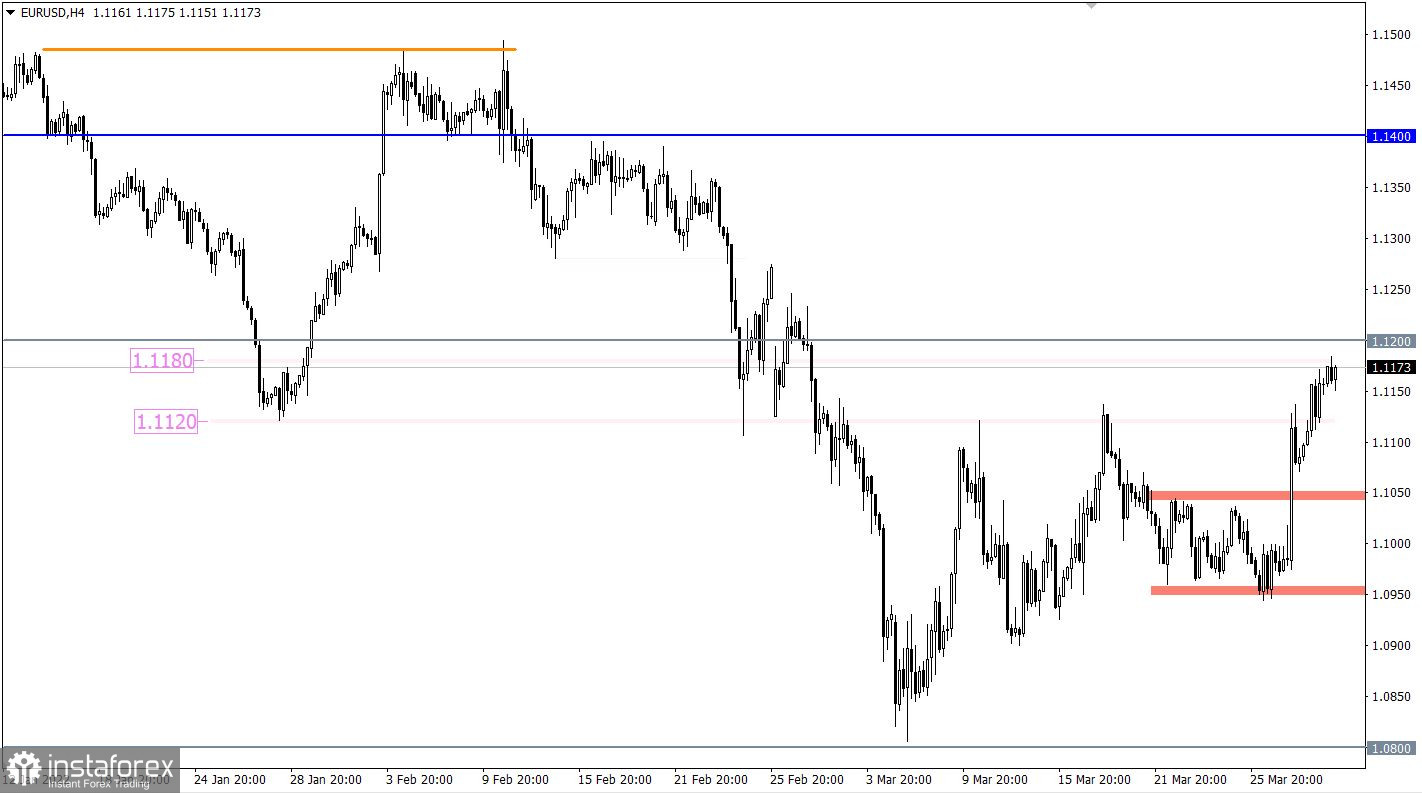
The EURUSD currency pair has grown by more than 200 points since the beginning of the week. The quote has reached the upper limit of the resistance area 1.1120/1.1180, without reducing the upward interest.
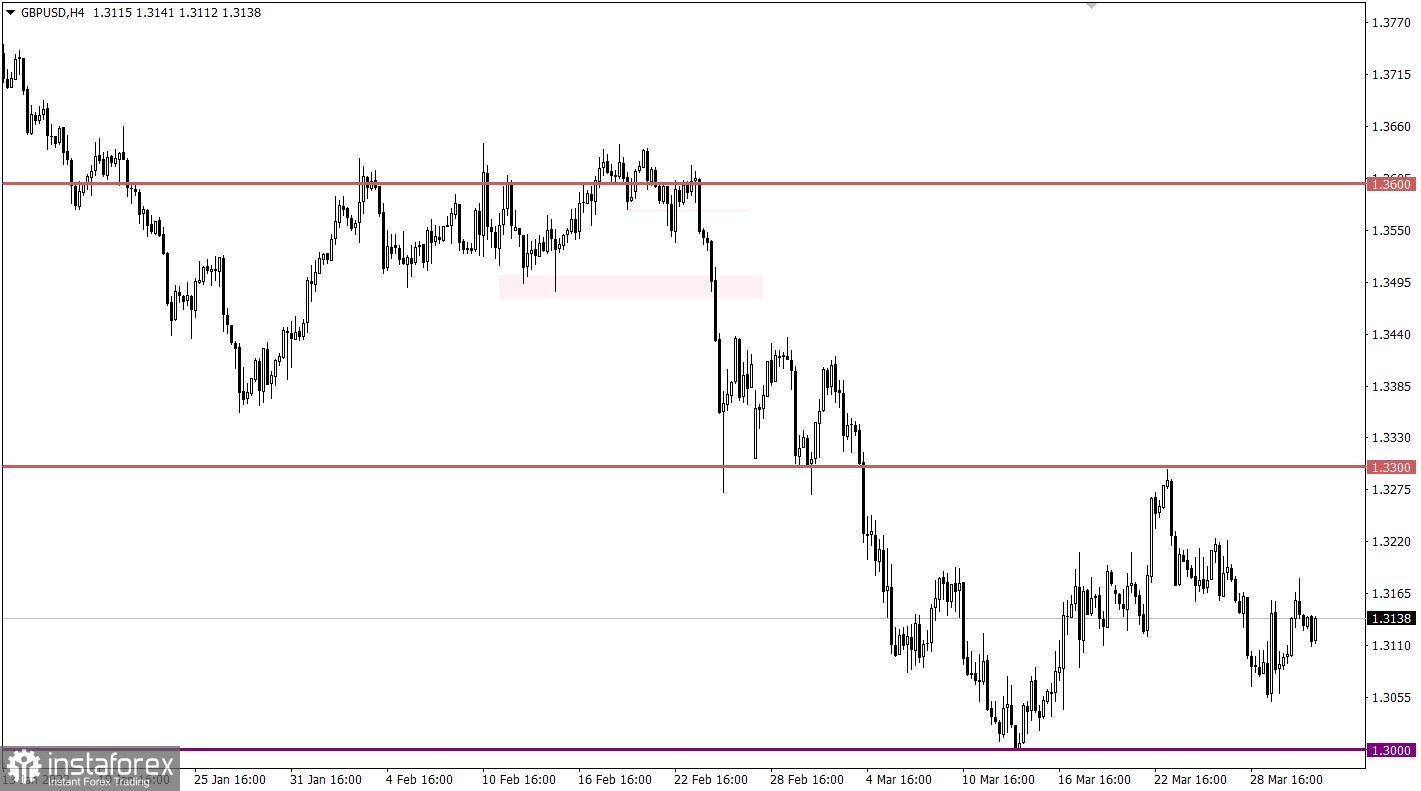
The GBPUSD currency pair, unlike its European counterpart, is in the process of recovery relative to the corrective move. Recently, the quote came close to the main pivot point in the form of a psychological level of 1.3000, where within its area there was a reduction in the volume of short positions and, as a result, a slowdown/pullback.

Today at 06:00 UTC, the final data on the UK GDP were published, which, although they reflected a slowdown in economic growth from 7.0% to 6.6%, the figures almost coincided with the preliminary estimate. Thus, the statistical indicator has already been taken into account by the market.
The European Union will publish data on the unemployment rate, which is likely to remain unchanged or with a slight decrease, which will be ignored by traders.
During the American trading session, the weekly data on jobless claims will be published, which is predicted to increase in volume. This is a negative factor for the U.S. labor market, which may have a negative impact on the dollar.
Statistics details:
The volume of initial claims for unemployment benefits may increase from 187,000 to 197,000.
Continuing claims may remain at the level of 1.350 million.
Time targeting
Unemployment rate in the EU - 09:00 Universal time
U.S. Jobless Claims - 12:30 Universal time
In this situation, the resistance area of 1.1120/1.1180 still attracts sellers. This can lead to a reduction in long positions and, as a result, a slowdown in the upward cycle. If expectations coincide with time, a price rebound may occur with the subsequent restoration of dollar positions relative to the correction.
An alternative scenario considers the transition from a normal correction to an oblong one. In this case, holding the price above the value of 1.1200 in a four-hour period will lead to the subsequent strengthening of the euro.
In this situation, the process of restoring dollar positions relative to the recent correction is still relevant. In order to receive a signal about the completion of the correction and prolongation of the medium-term downward trend, the quote needs to stay below the psychological level of 1.3000, followed by confirmation at the value of 1.2950. Otherwise, the existing recovery process may be replaced by a lateral amplitude.
A candlestick chart view is graphical rectangles of white and black light, with sticks on top and bottom. When analyzing each candle in detail, you will see its characteristics of a relative period: the opening price, closing price, and maximum and minimum prices.
Horizontal levels are price coordinates, relative to which a stop or a price reversal may occur. These levels are called support and resistance in the market.
Circles and rectangles are highlighted examples where the price of the story unfolded. This color selection indicates horizontal lines that may put pressure on the quote in the future.
The up/down arrows are the reference points of the possible price direction in the future.
*这里的市场分析是为了增加您对市场的了解,而不是给出交易的指示。
InstaSpot分析评论将让您充分了解市场趋势! 作为InstaSpot的客户,您将获得大量的免费服务以实现有效的交易。


