


我们的团队有超过700万的操盘手!
我们每天都在一起努力改善交易。我们得到了很高的成绩,并继续前进。
世界各地数以百万计的操盘手的认可是我们工作的最大赞赏! 您做出了您的选择,我们将尽一切努力来满足您的期望!
我们是一个共同的伟大团队!
InstaSpot. 自豪地为您工作!


Preliminary data on business activity indices for March in Europe, Britain, and the United States were published. They expected a widespread decline in performance, but instead saw an increase. The discrepancy in expectations did not affect the market in any way due to the ongoing pressure from the information flow.
In the United States, weekly data on jobless claims were also published, where they recorded a decrease in their volume, but this factor did not play into the currency market.
Statistics details:
The volume of initial claims for unemployment benefits decreased from 215,000 to 187,000.
The volume of continuing claims decreased from 1.417 million to 1.350 million.
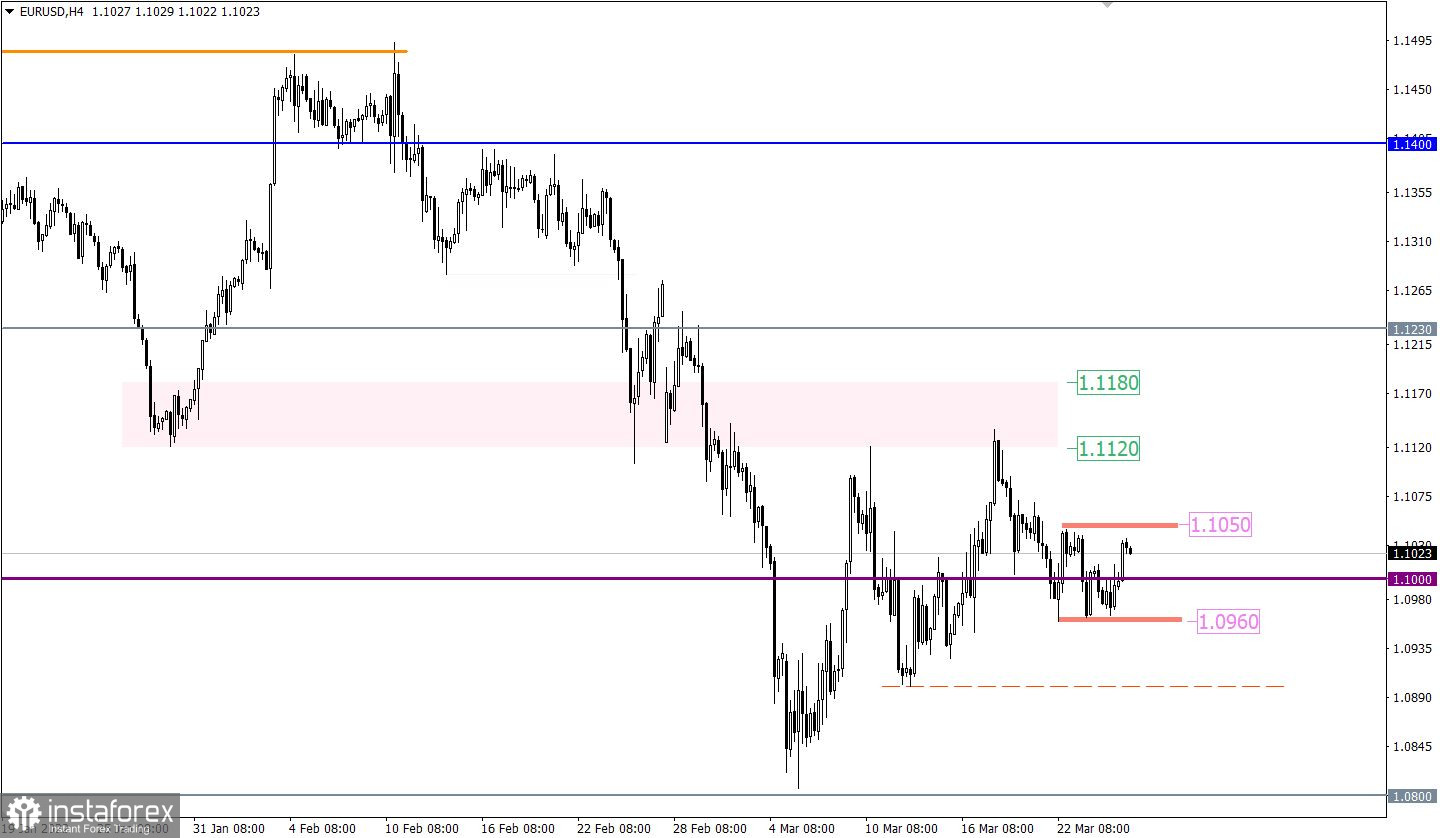
The EURUSD currency pair once again found a foothold in the area of 1.0960. This led to a reduction in the volume of short positions and, as a result, a price rebound.
On the trading chart of the daily period, a downward trend formed where a three-week corrective move has appeared from the support level of 1.0800.
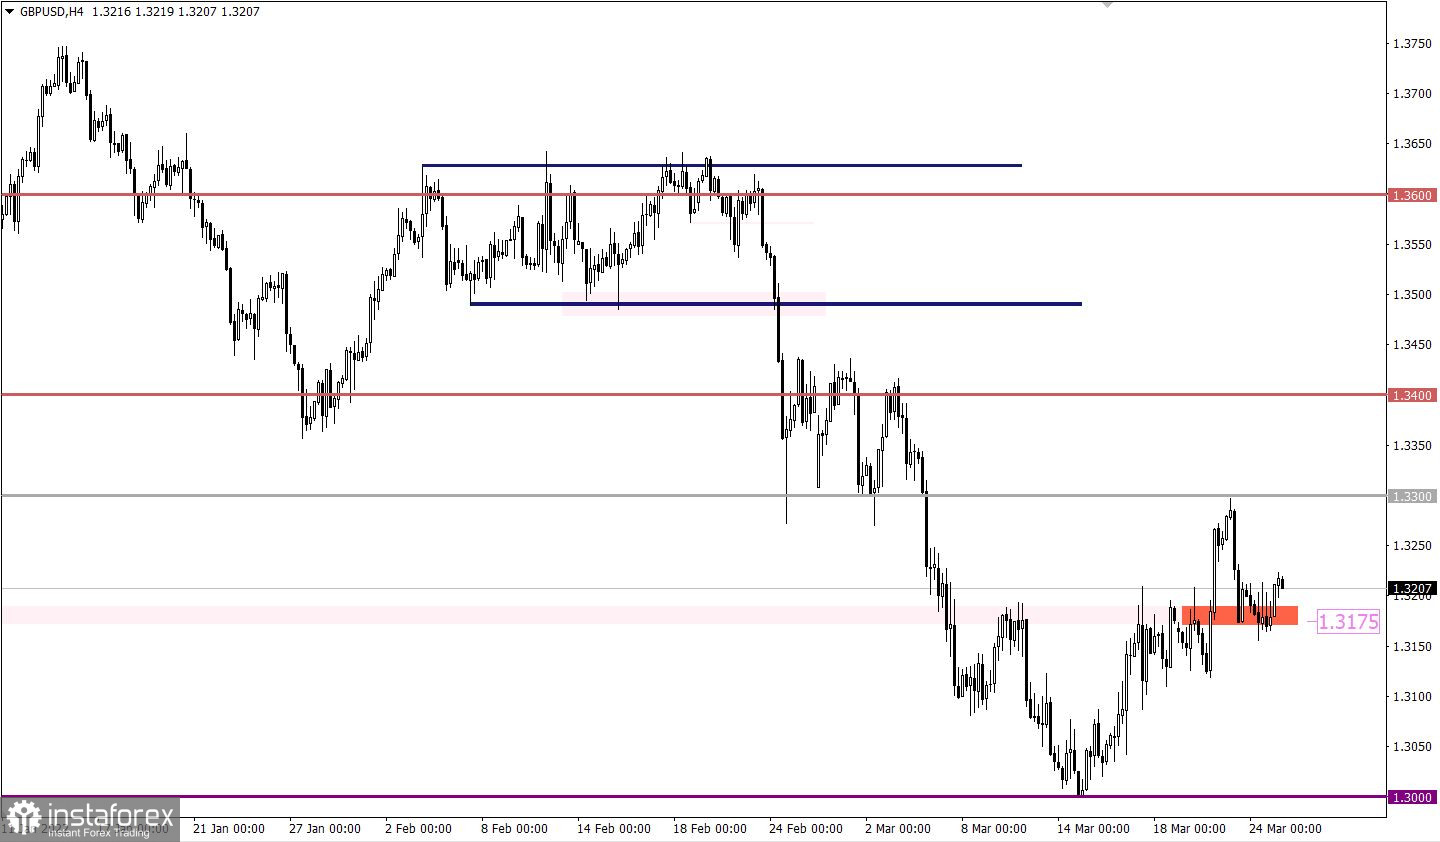
The GBPUSD currency pair on the way of the downward move met a variable pivot point in the face of the value of 1.3175. Initially, there was a stagnation within this mark, which was expressed in the form of versatile Doji-type candles, after which the price began to roll back.

Today at 07:00 UTC, data on retail sales in the UK were published, the growth rate of which slowed down from 9.1% to 7.0%.
It is worth considering that the data was published for February, and given the current situation, they are no longer considered informative, since the March figures may turn out to be more deplorable.
In this situation, the corrective move is still relevant in the market, despite repeated attempts to change trading interests. An increase in the volume of long positions is possible if the price holds above the value of 1.1050 in a four-hour period. In this case, buyers will have a chance to prolong the correction. A downside scenario will be considered by traders if the price holds below 1.0960 in a four-hour period. This step will indicate the completion of the corrective move.
During the recent rebound, there was an increase in the volume of long positions, which stimulated traders to action. The subsequent growth in the value of the pound sterling should be expected after the price holds above 1.3230. This move may lead to another touch of the resistance level 1.3300. At the same time, the downward scenario along the path of the main trend is considered by market participants. For a signal to sell the pound, the quote needs to stay below 1.3150 in a four-hour period.
A candlestick chart view is graphical rectangles of white and black light, with sticks on top and bottom. When analyzing each candle in detail, you will see its characteristics of a relative period: the opening price, closing price, and maximum and minimum prices.
Horizontal levels are price coordinates, relative to which a stop or a price reversal may occur. These levels are called support and resistance in the market.
Circles and rectangles are highlighted examples where the price of the story unfolded. This color selection indicates horizontal lines that may put pressure on the quote in the future.
The up/down arrows are the reference points of the possible price direction in the future.
*这里的市场分析是为了增加您对市场的了解,而不是给出交易的指示。
InstaSpot分析评论将让您充分了解市场趋势! 作为InstaSpot的客户,您将获得大量的免费服务以实现有效的交易。


