


The legend in the InstaSpot team!
Legend! You think that's bombastic rhetoric? But how should we call a man, who became the first Asian to win the junior world chess championship at 18 and who became the first Indian Grandmaster at 19? That was the start of a hard path to the World Champion title for Viswanathan Anand, the man who became a part of history of chess forever. Now one more legend in the InstaSpot team!


Borussia is one of the most titled football clubs in Germany, which has repeatedly proved to fans: the spirit of competition and leadership will certainly lead to success. Trade in the same way that sports professionals play the game: confidently and actively. Keep a "pass" from Borussia FC and be in the lead with InstaSpot!
The growth rate of consumer prices in Britain accelerated from 5.5% to 6.2%. Taking into account that last week the Bank of England announced the forecast of inflation growth to 7.0%, the current figures were not something surprising in the market.
During the American trading session, data on new home sales in the United States will be published, where they predict an increase in the indicator. Given the time of publication and the level of importance, one should not expect any strong reaction in the market.
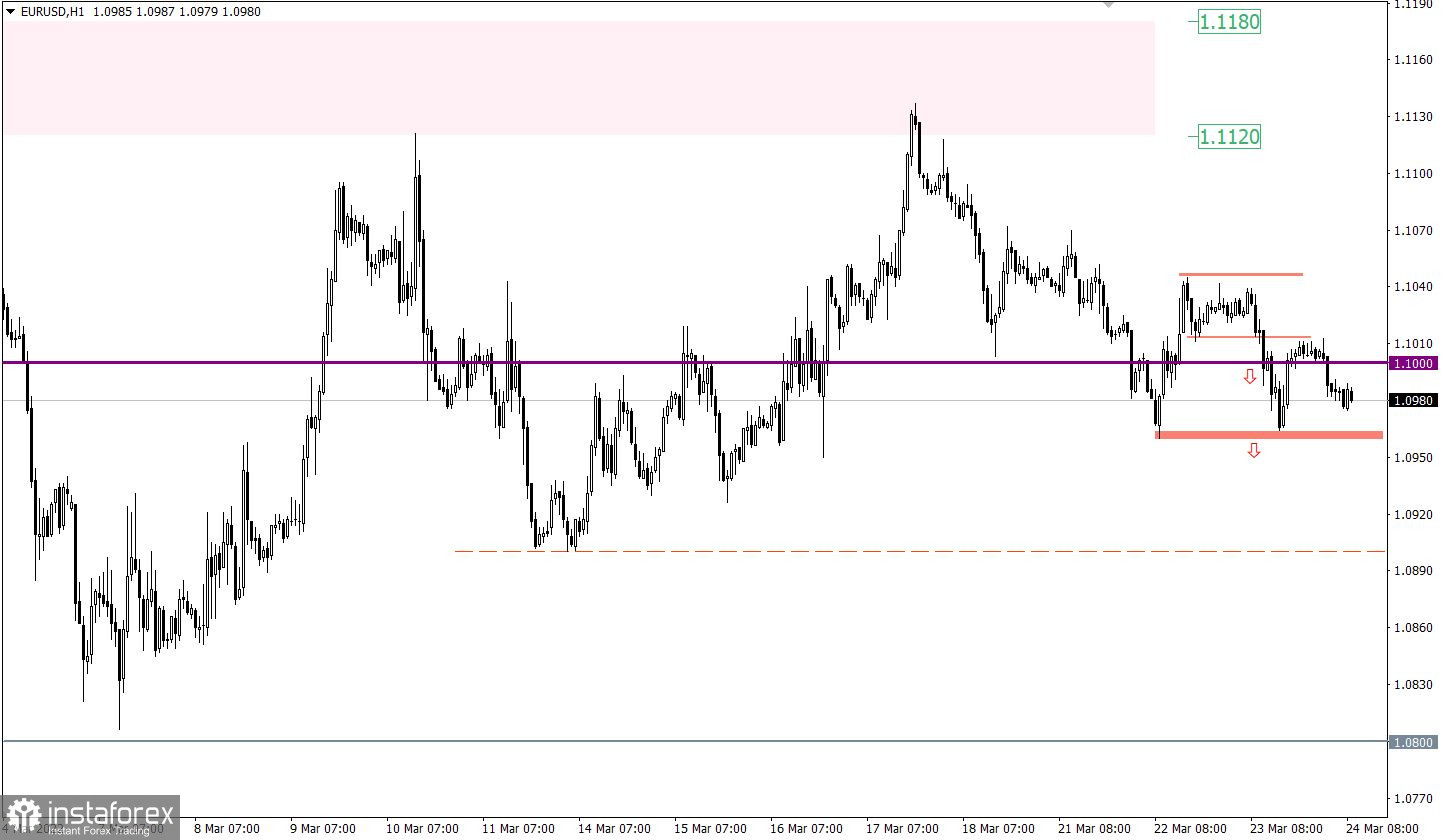
The EURUSD currency pair completed the consolidation move in the range of 1.1010/1.1045 by breaking the lower border. This move led to speculative activity, which allowed traders to hold below the psychological level of 1.1000.
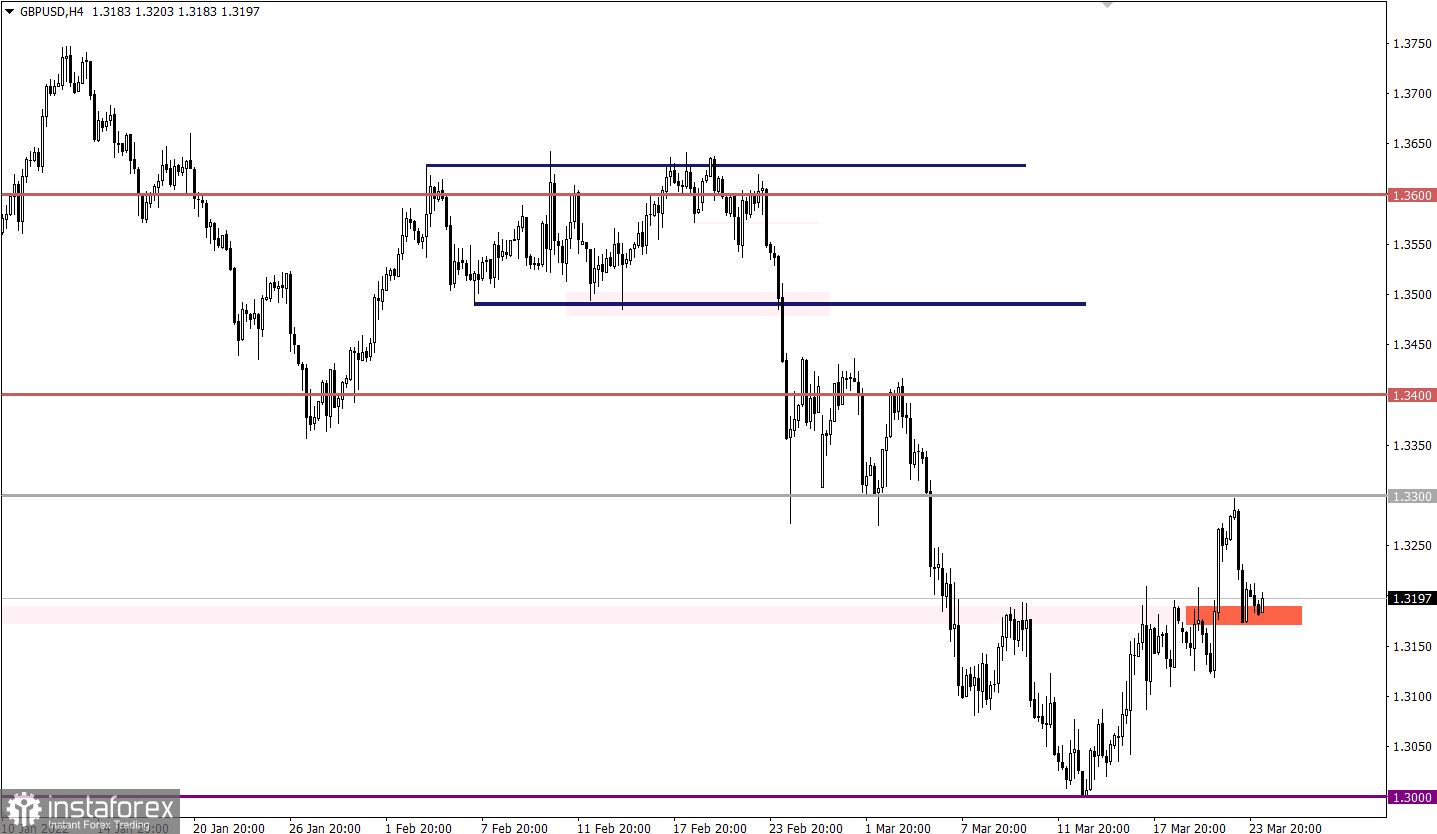
The GBPUSD currency pair, during an intensive upward movement, reached the resistance level of 1.3300, where there was a reduction in the volume of long positions. This led to a rebound in prices and a partial recovery in the U.S. dollar.

Preliminary data on business activity indices for March in Europe, Britain, and the United States will be published today. They expect a widespread decline in indicators, which may lead to the absence of any reaction in the market if forecasts coincide.
For the United States, data on applications for unemployment benefits will also be published today, where they predict a reduction in their volume. This is a positive factor for the U.S. labor market, which may affect the dollar exchange rate.
Statistics details:
The volume of initial claims for benefits may be reduced from 214,000 to 212,000.
The volume of continuing claims may be reduced from 1.419 million to 1.410 million.
Time targeting
Indices for business activity in the EU - 09:00 Universal time
Indices for business activity in Britain - 09:30 Universal time
U.S. Jobless Claims - 12:30 Universal time
Indices for business activity in the U.S. - 13:45 Universal time
Information and news flow
The summit of EU leaders, as well as the visit of US President Joe Biden to Europe, may push traders to speculative operations. It is worth closely following the flow of news regarding new sanctions against the Russian Federation and the possible imposition of an embargo on oil and gas supplies from Russia.
In this situation, the initial signal to sell the euro was received in the course of holding the price below the level of 1.1000. The strengthening of the existing signal will occur when the price is kept below 1.0960 in a four-hour period. This step may well restart dollar positions in the direction of 1.0900-1.0800. Otherwise, we are waiting for a bump in the boundaries of 1.0960 / 1.1150.
During the rebound, the quote returned to the area of 1.3175, where there was a slight stagnation. Holding the price below it in a four-hour period will lead to a subsequent increase in the volume of short positions, which will strengthen the downward move.
An alternative scenario for the development of the quote considers the current pullback as part of a corrective move from the 1.3000 level. In this case, the absence of price retention below 1.3175 may lead to a new correction cycle.
A candlestick chart view is graphical rectangles of white and black light, with sticks on top and bottom. When analyzing each candle in detail, you will see its characteristics of a relative period: the opening price, closing price, and maximum and minimum prices.
Horizontal levels are price coordinates, relative to which a stop or a price reversal may occur. These levels are called support and resistance in the market.
Circles and rectangles are highlighted examples where the price of the story unfolded. This color selection indicates horizontal lines that may put pressure on the quote in the future.
The up/down arrows are the reference points of the possible price direction in the future.
*这里的市场分析是为了增加您对市场的了解,而不是给出交易的指示。
InstaSpot分析评论将让您充分了解市场趋势! 作为InstaSpot的客户,您将获得大量的免费服务以实现有效的交易。


