


我们的团队有超过700万的操盘手!
我们每天都在一起努力改善交易。我们得到了很高的成绩,并继续前进。
世界各地数以百万计的操盘手的认可是我们工作的最大赞赏! 您做出了您的选择,我们将尽一切努力来满足您的期望!
我们是一个共同的伟大团队!
InstaSpot. 自豪地为您工作!


Tuesday is not much different from Monday, the macroeconomic calendar was empty. Traders focused on the information flow.
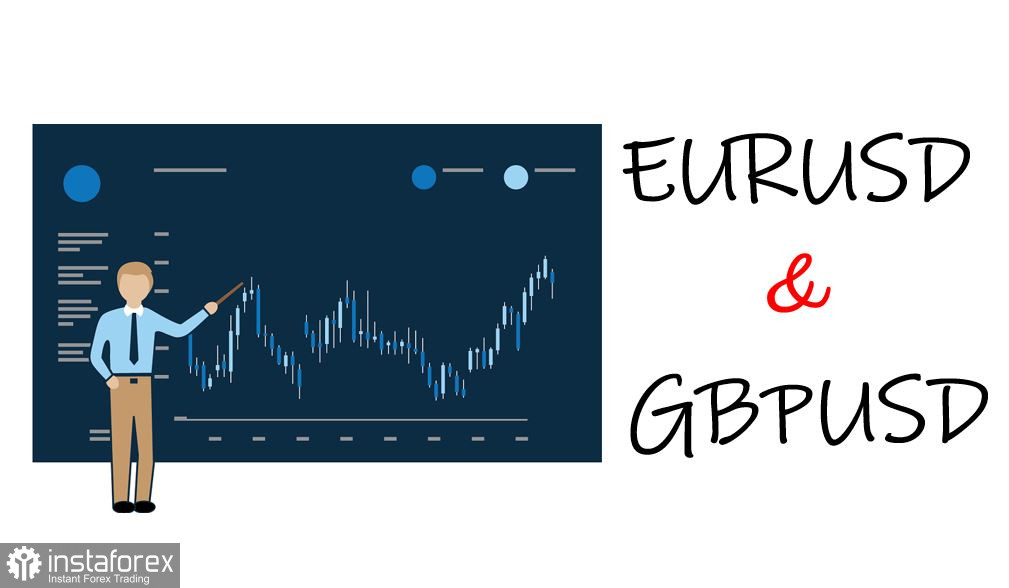
The EURUSD currency pair, after a short walk below the level of 1.1000, has moved into the pullback stage. This movement has partially restored the euro rate, while the downward mood remains in the market.
The GBPUSD currency pair, after several days of stagnation in the range of 1.3100/1.3200, managed to overcome its upper limit. The breakdown was accompanied by high speculative interest, which led to the strengthening of the pound sterling by more than 140 points.
Today, data on inflation in Britain were published, the growth rate of consumer prices accelerated from 5.5% to 6.2%. Taking into account the fact that last week the Bank of England announced a forecast of inflation growth to 7.0%, the current figures did not become something surprising in the market.
During the American trading session, data on new home sales in the United States will be published, where they predict an increase in the indicator. Given the time of publication and the level of importance of the data, one should not expect any strong reaction in the market.
In this situation, special attention is paid to consolidation in the range of 1.1010/1.1045, as it focuses speculators on itself. The breakdown of one or another stagnation boundary is highly likely to lead to new price jumps.
We concretize the above into trading signals:
Buy positions on the currency pair are taken into account after holding the price above the value of 1.1050 with the prospect of a move to 1.1070–1.1100.
Sell positions should be considered after holding the price below 1.1000 with the prospect of a move to 1.0960–1.0900.
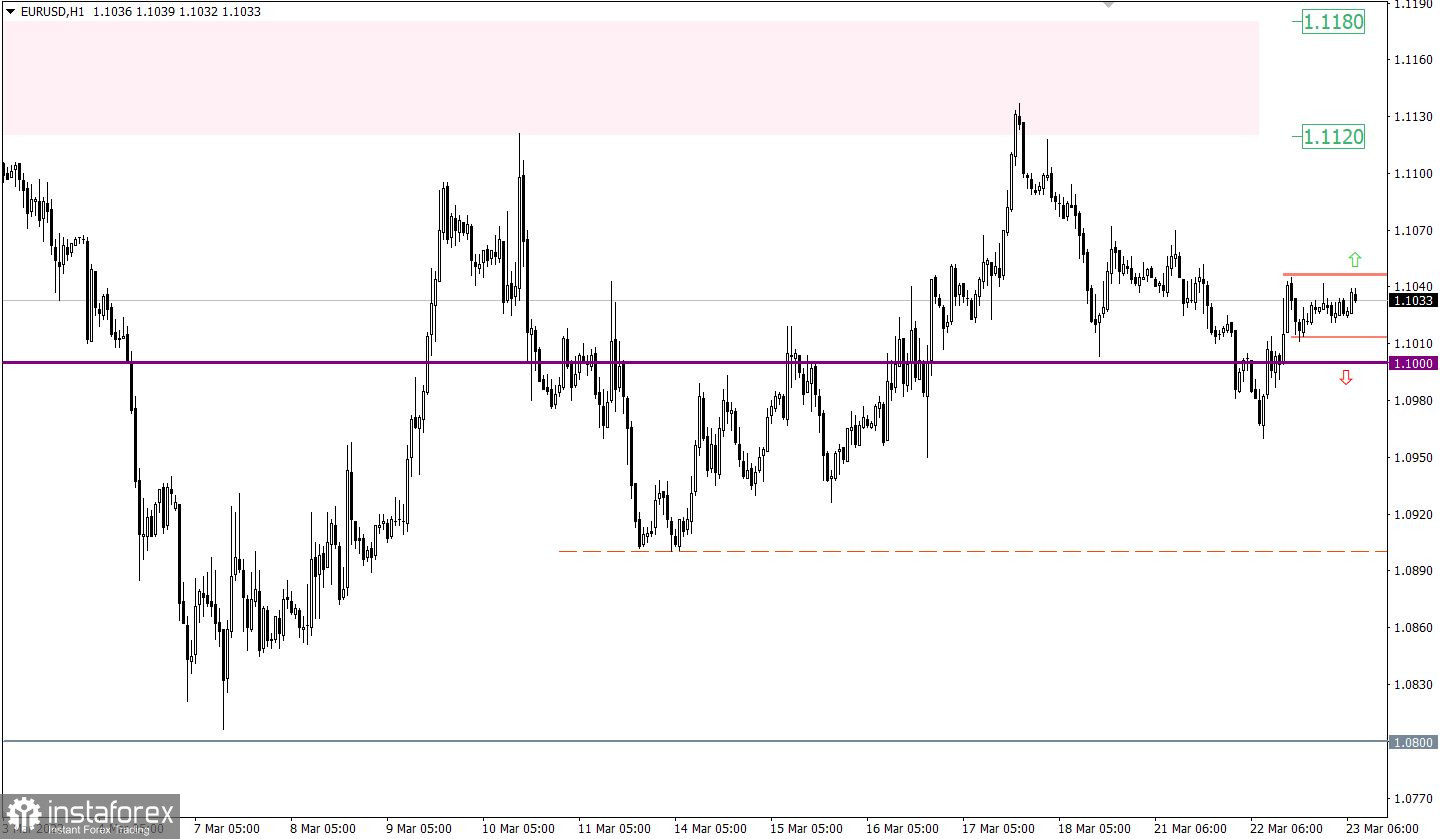
The corrective move from the psychological level of 1.3000 is not just preserved in the market, it has been prolonged. Now the value of 1.3300 stands in the way of traders, where in case of its breakdown, a subsequent move towards 1.3370 is not excluded.
An alternative scenario for the development of the quote will be considered by traders, in case of confirmation of the signal that the pound sterling is overbought. In this case, the quotes may slow down relative to the current values, with the subsequent recovery of dollar positions.
A candlestick chart view is graphical rectangles of white and black light, with sticks on top and bottom. When analyzing each candle in detail, you will see its characteristics of a relative period: the opening price, closing price, and maximum and minimum prices.
Horizontal levels are price coordinates, relative to which a stop or a price reversal may occur. These levels are called support and resistance in the market.
Circles and rectangles are highlighted examples where the price of the story unfolded. This color selection indicates horizontal lines that may put pressure on the quote in the future.
The up/down arrows are the reference points of the possible price direction in the future.
*这里的市场分析是为了增加您对市场的了解,而不是给出交易的指示。
InstaSpot分析评论将让您充分了解市场趋势! 作为InstaSpot的客户,您将获得大量的免费服务以实现有效的交易。


