


我们的团队有超过700万的操盘手!
我们每天都在一起努力改善交易。我们得到了很高的成绩,并继续前进。
世界各地数以百万计的操盘手的认可是我们工作的最大赞赏! 您做出了您的选择,我们将尽一切努力来满足您的期望!
我们是一个共同的伟大团队!
InstaSpot. 自豪地为您工作!


Monday was traditionally accompanied by a blank macroeconomic calendar. Nevertheless, there was an information and news flow on the market.
The main theses of the speech of the ECB and the Fed (21/03/22):
ECB President Christine Lagarde: ECB monetary policy will not be synchronized with Fed policy
Atlanta Fed President and FOMC Member Raphael Bostic:
- geopolitics = uncertainty for the economy and markets
- supply chain situation could worsen further
- geopolitics can increase inflationary pressures
- control over the growth of inflation is the No. 1 priority
- Fed rate hike forecast = 6 hikes in 2022 and 2 hikes in 2023
Fed Chairman Jerome Powell:
- we are far from equilibrium on the Fed's balance sheet
- The Fed may go for a faster balance sheet cut
- The Fed will raise rates immediately by 0.5% if necessary
- we do not expect short-term progress in reducing inflation
- I do not see an increased likelihood of a recession in 2023
The comments of the chairmen of the Fed and the ECB provided local support to the U.S. dollar.
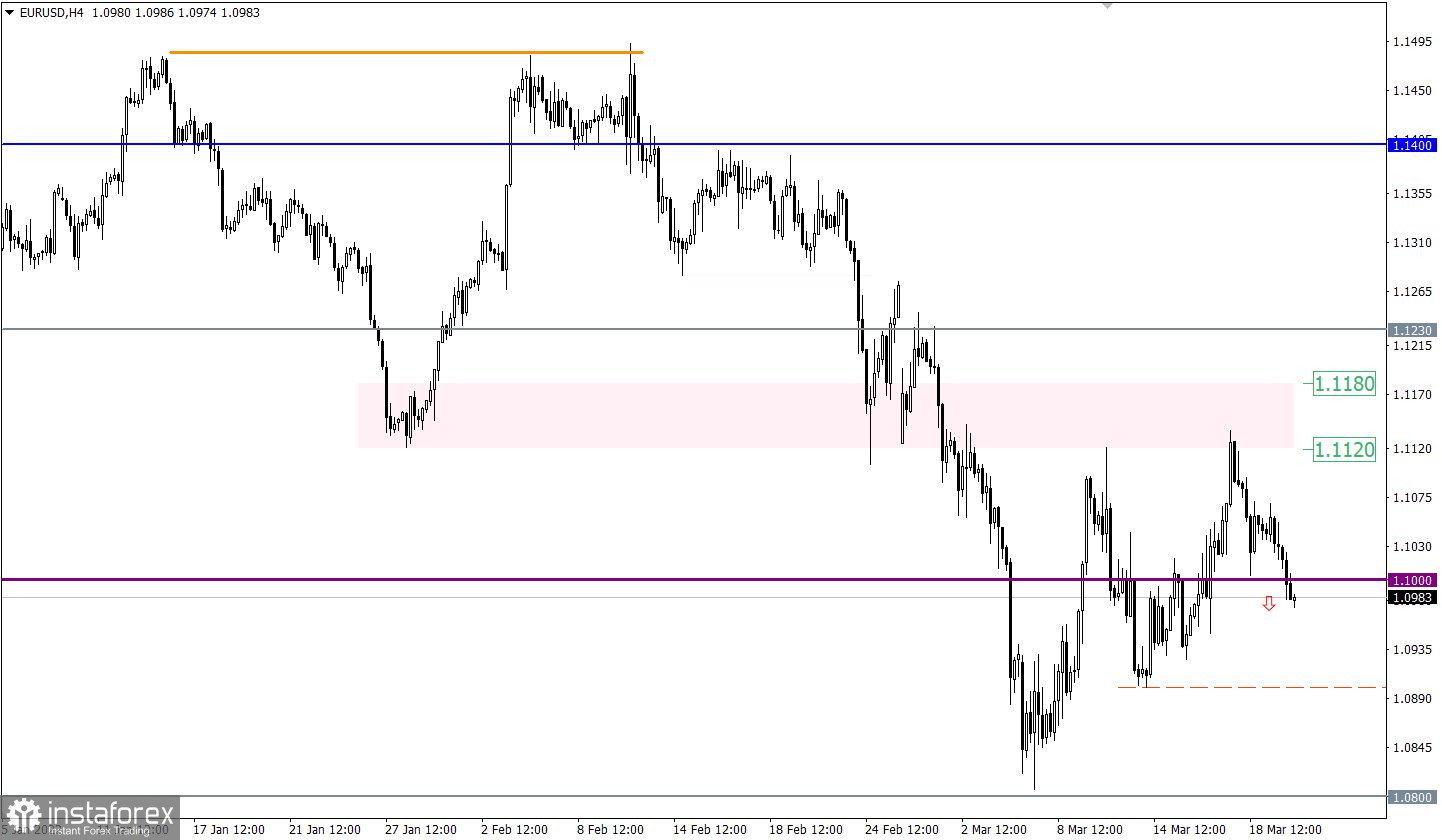
The EURUSD currency pair managed to strengthen the downward movement from the resistance area after the breakdown of the psychological level of 1.1000. This move indicates the prevailing interest of traders in dollar positions, which, as a result, may lead to the completion of a corrective move.
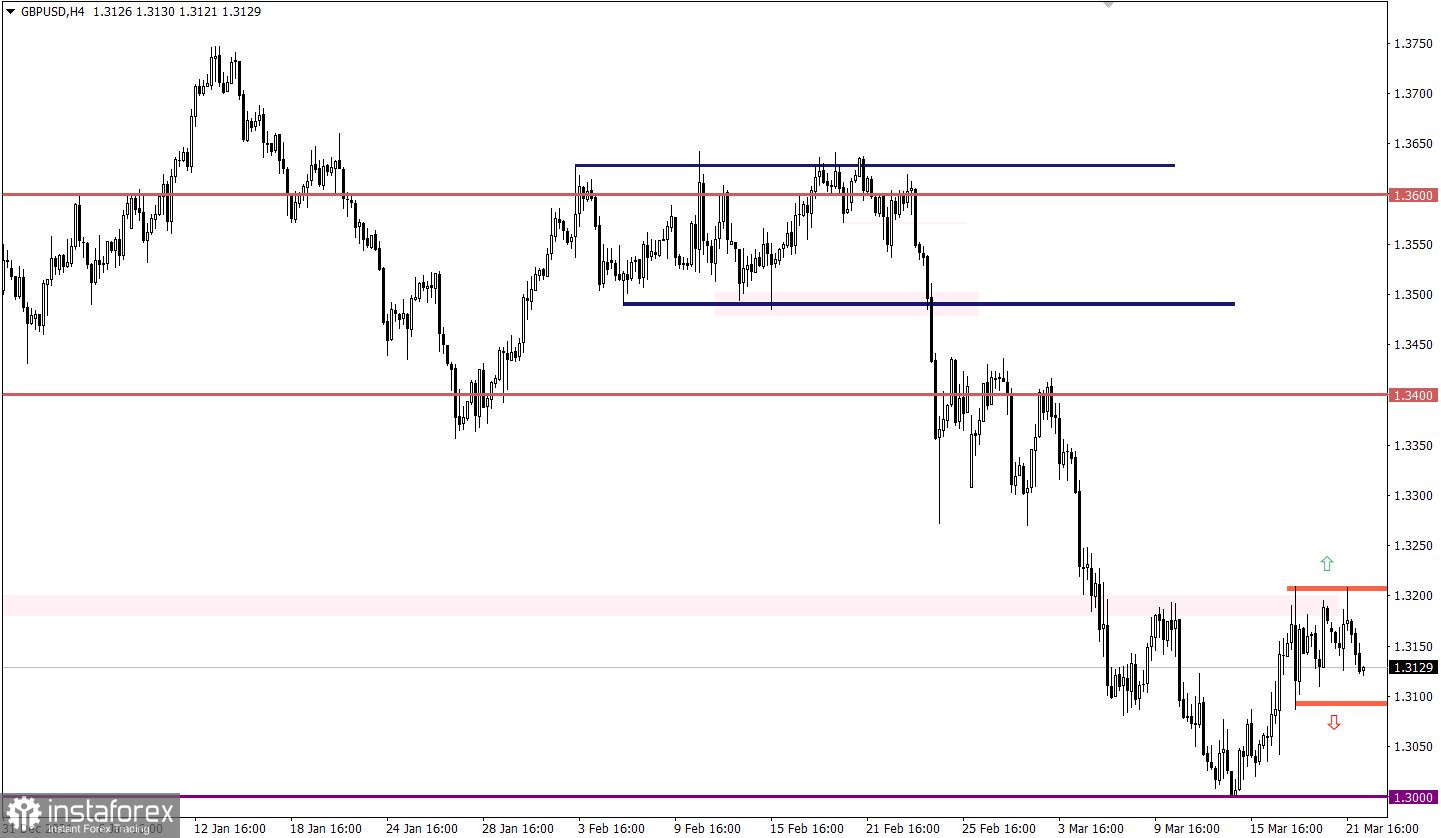
The GBPUSD currency pair has been moving within the 1.3180/1.3200 resistance area for several days in a row. This led to a slowdown in the corrective move and, as a result, a sideways amplitude of 1.3100/1.3200.
Tuesday is not much different from Monday, the macroeconomic calendar is still empty. Traders will continue to analyze the information flow for hot topics.
Stable retention of the price below the level of 1.1000 may well lead to a subsequent recovery of dollar positions relative to the recent correction. In case of a coincidence of expectations, the euro rate may fall to the values of 1.0900-1.0800.
An alternative scenario for the development of the market will be considered by traders if the quote returns above 1.1050. This step may well disrupt the recovery process.
In this situation, traders are still considering the trading tactics of breaking one or another control value relative to the price stagnation. In this regard, buy positions will be valid after holding the price above 1.3210 in a four-hour period, and sell positions would be active after holding the price below 1.3080 in a four-hour period.
A candlestick chart view is graphical rectangles of white and black light, with sticks on top and bottom. When analyzing each candle in detail, you will see its characteristics of a relative period: the opening price, closing price, and maximum and minimum prices.
Horizontal levels are price coordinates, relative to which a stop or a price reversal may occur. These levels are called support and resistance in the market.
Circles and rectangles are highlighted examples where the price of the story unfolded. This color selection indicates horizontal lines that may put pressure on the quote in the future.
The up/down arrows are the reference points of the possible price direction in the future.
*这里的市场分析是为了增加您对市场的了解,而不是给出交易的指示。
InstaSpot分析评论将让您充分了解市场趋势! 作为InstaSpot的客户,您将获得大量的免费服务以实现有效的交易。


